 4
4peptides
spectra
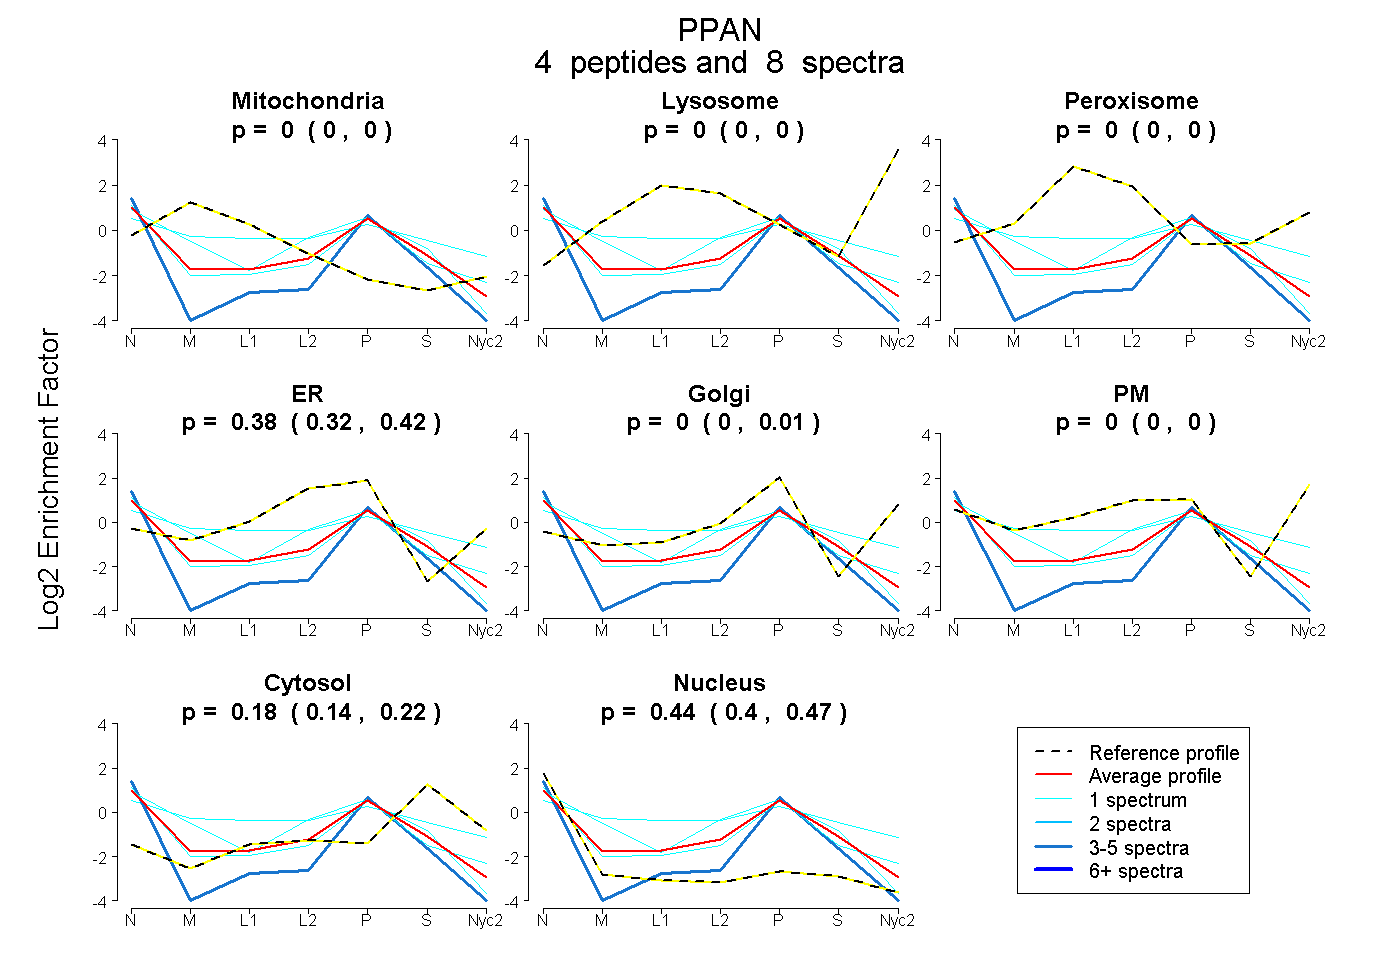
0.000 | 0.000
0.000 | 0.000
0.000 | 0.000
0.317 | 0.415
0.000 | 0.014
0.000 | 0.000
0.139 | 0.216
0.398 | 0.469
| Plot | Mito | Lyso | Perox | ER | Golgi | PM | Cytosol | Nucleus | |||||
| Expt A |
4 peptides |
8 spectra |
|
0.000 0.000 | 0.000 |
0.000 0.000 | 0.000 |
0.000 0.000 | 0.000 |
0.379 0.317 | 0.415 |
0.000 0.000 | 0.014 |
0.000 0.000 | 0.000 |
0.181 0.139 | 0.216 |
0.440 0.398 | 0.469 |
| 5 spectra, GNMQAQQSAVR | 0.000 | 0.000 | 0.000 | 0.034 | 0.160 | 0.000 | 0.083 | 0.724 | ||
| 1 spectrum, NLEAYAAQPHSFVFTR | 0.067 | 0.000 | 0.000 | 0.517 | 0.000 | 0.000 | 0.083 | 0.334 | ||
| 1 spectrum, DLGPPSR | 0.191 | 0.000 | 0.074 | 0.272 | 0.000 | 0.102 | 0.296 | 0.065 | ||
| 1 spectrum, SVQQLSLDVR | 0.000 | 0.000 | 0.000 | 0.298 | 0.000 | 0.000 | 0.201 | 0.501 |
| Plot | Mito | Lyso or Perox | ER | Golgi | PM | Cytosol | Nucleus | ||||||
| Expt B |
1 peptide |
1 spectrum |
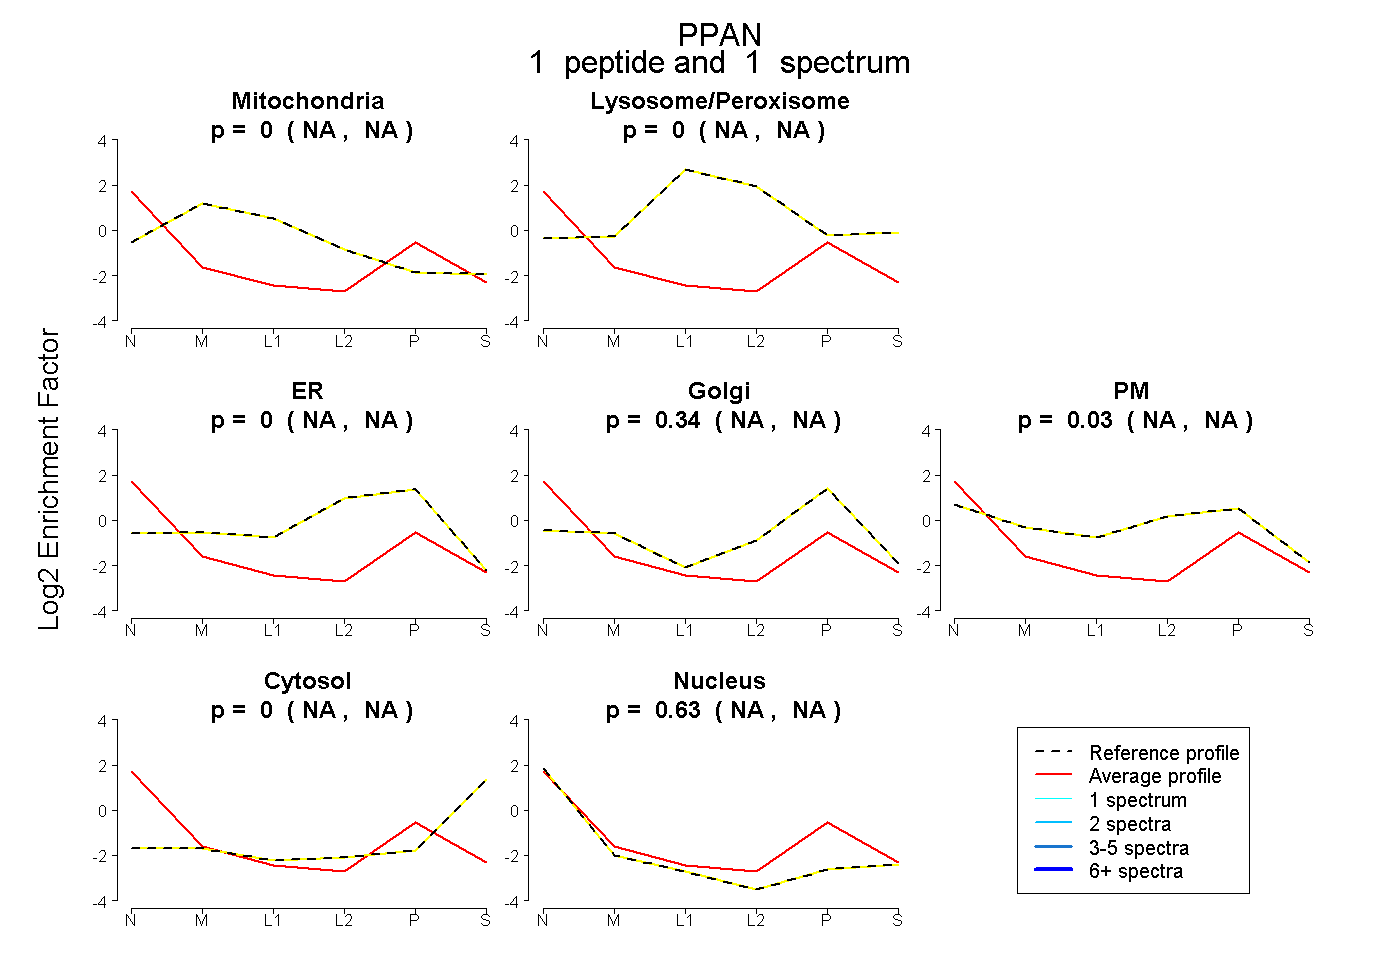 |
0.000 NA | NA |
0.000 NA | NA |
0.000 NA | NA |
0.339 NA | NA |
0.033 NA | NA |
0.000 NA | NA |
0.628 NA | NA |