 3
3peptides
spectra
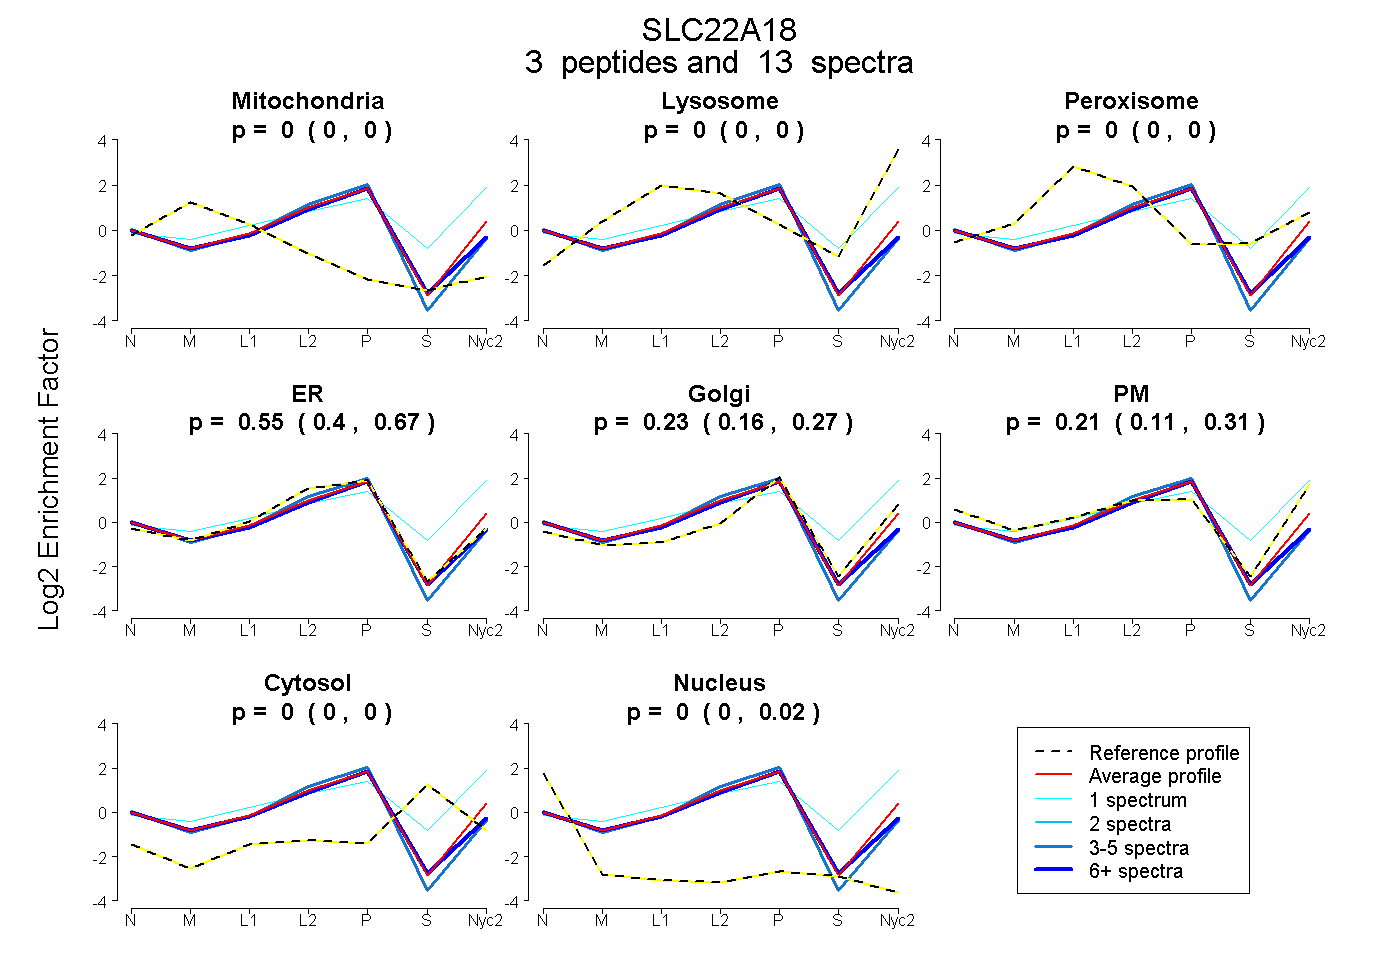
0.000 | 0.000
0.000 | 0.000
0.000 | 0.000
0.401 | 0.670
0.159 | 0.272
0.106 | 0.314
0.000 | 0.000
0.000 | 0.024
2peptides
spectra

0.000 | 0.000
0.050 | 0.134
0.484 | 0.622
0.050 | 0.182
0.175 | 0.264
0.000 | 0.000
0.000 | 0.000
4peptides
spectra
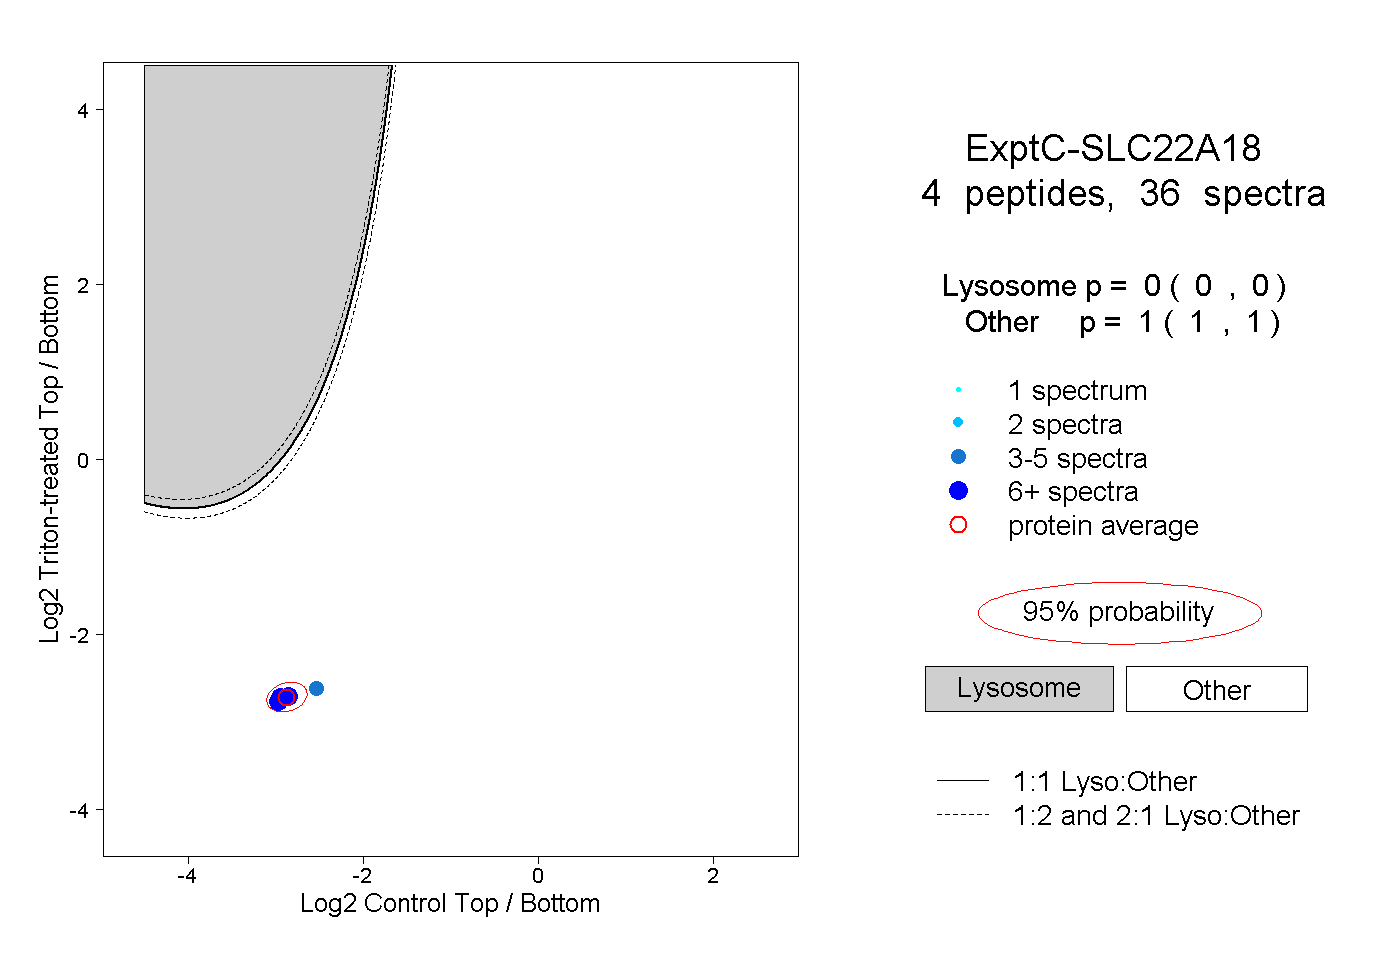
0.000 | 0.000
1.000 | 1.000
4peptides
spectra
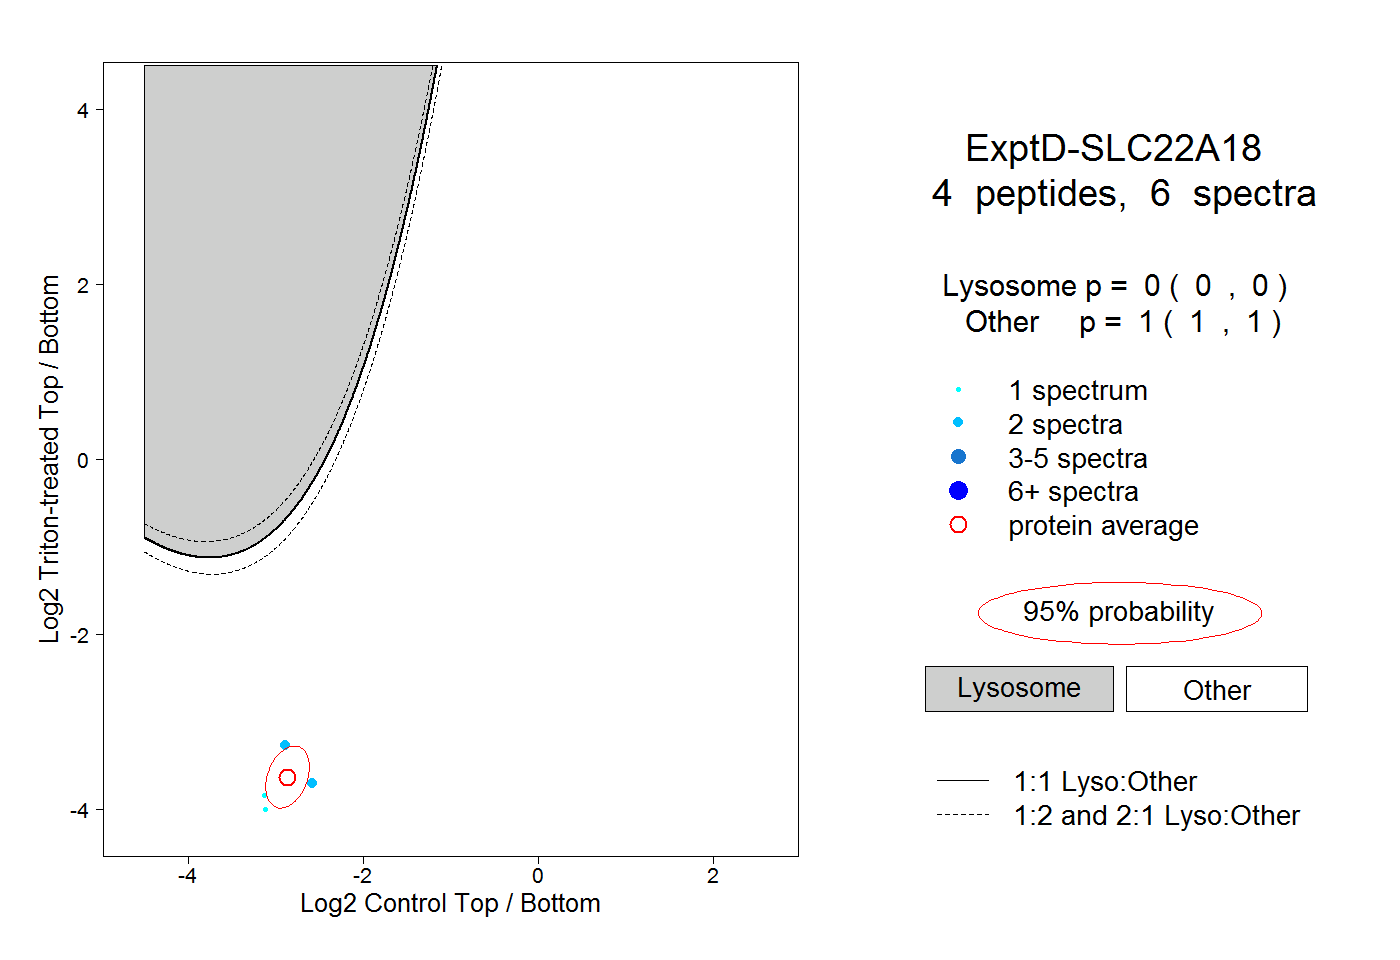
0.000 | 0.000
1.000 | 1.000