 9
9peptides
spectra
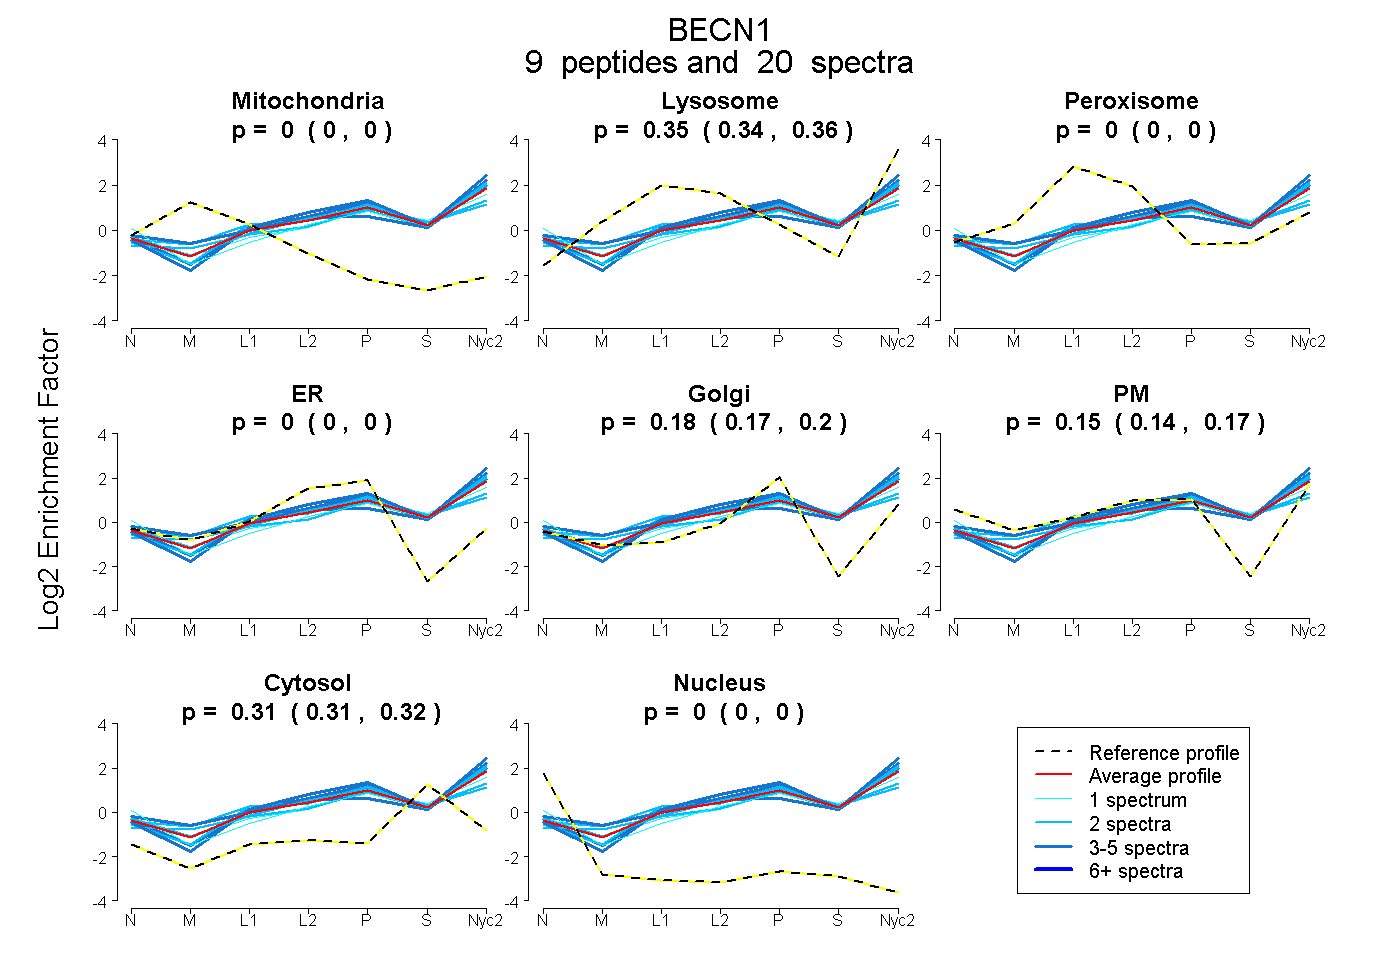
0.000 | 0.000
0.339 | 0.360
0.000 | 0.000
0.000 | 0.000
0.166 | 0.197
0.136 | 0.171
0.306 | 0.318
0.000 | 0.000
13peptides
spectra
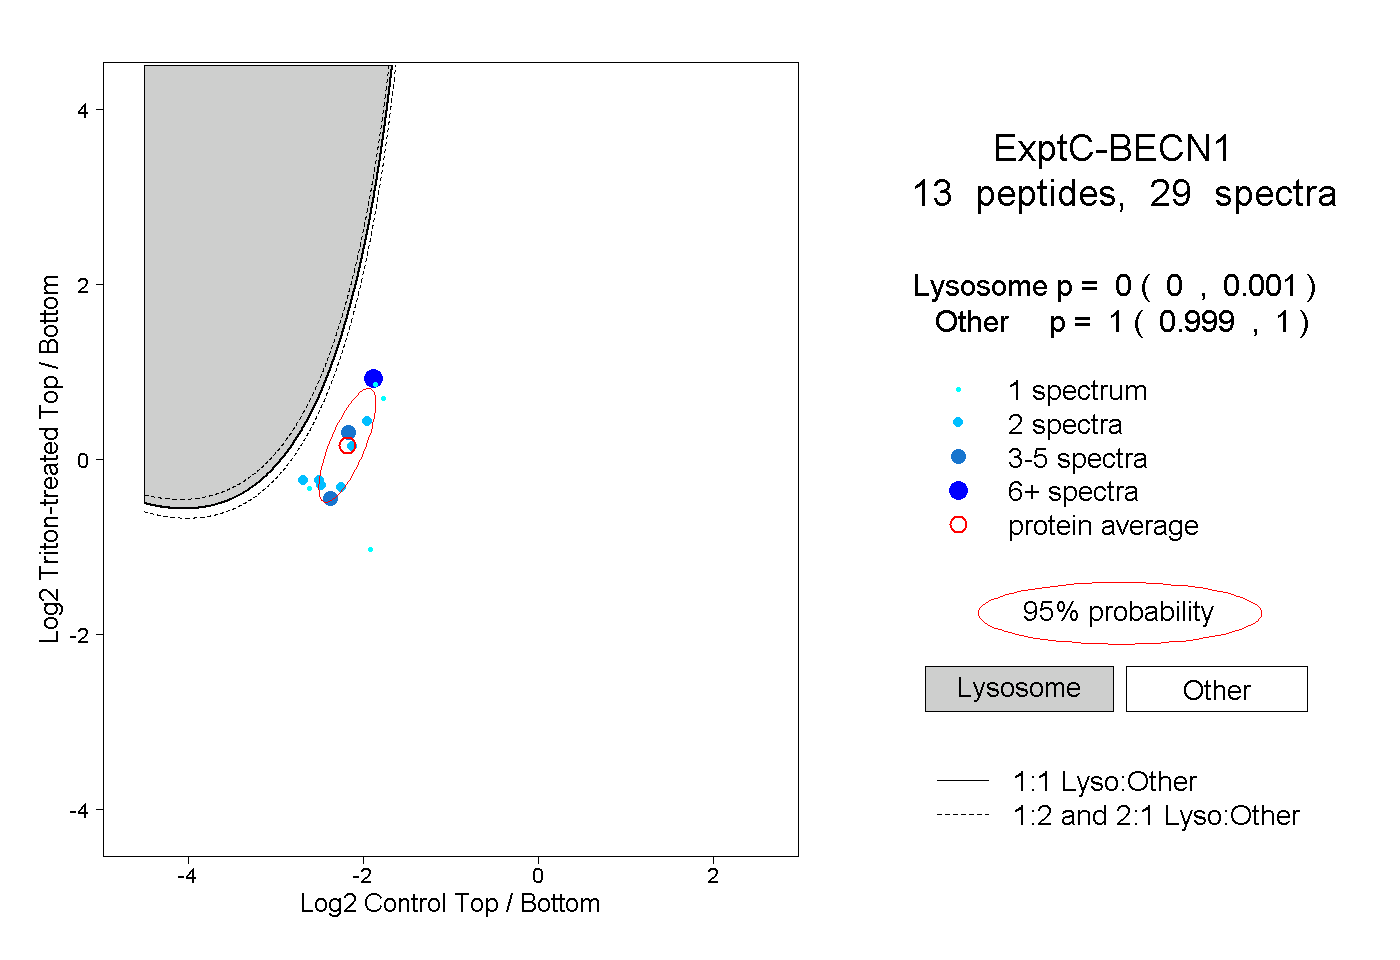
0.000 | 0.001
0.999 | 1.000
3peptides
spectra
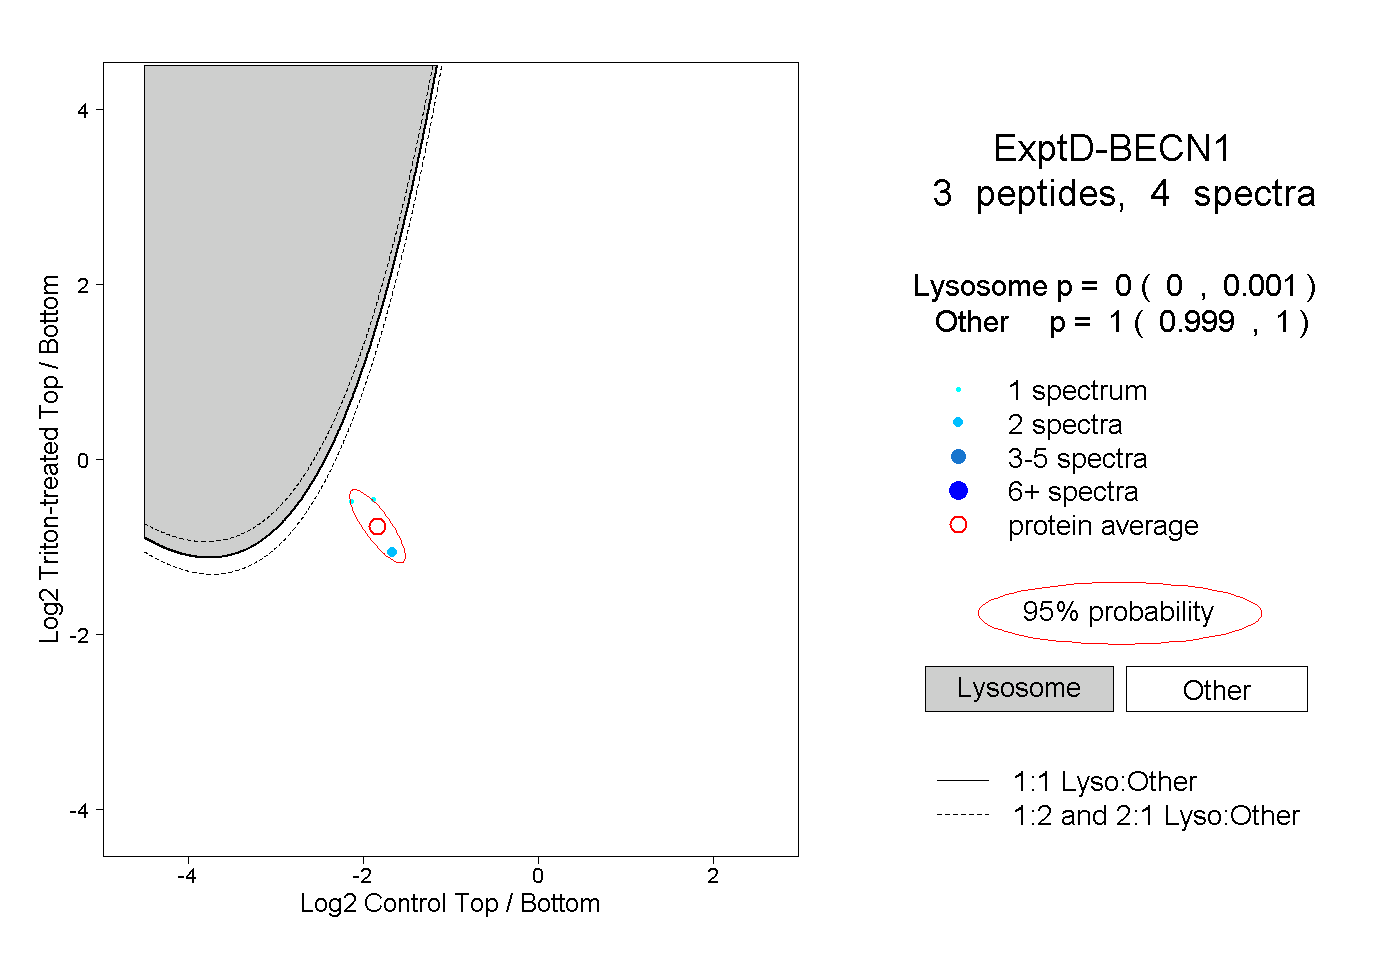
0.000 | 0.001
0.999 | 1.000