 4
4peptides
spectra

0.000 | 0.000
0.000 | 0.000
0.000 | 0.000
0.082 | 0.274
0.000 | 0.148
0.000 | 0.000
0.299 | 0.344
0.374 | 0.463
| Plot | Mito | Lyso | Perox | ER | Golgi | PM | Cytosol | Nucleus | |||||
| Expt A |
4 peptides |
7 spectra |
|
0.000 0.000 | 0.000 |
0.000 0.000 | 0.000 |
0.000 0.000 | 0.000 |
0.247 0.082 | 0.274 |
0.000 0.000 | 0.148 |
0.000 0.000 | 0.000 |
0.331 0.299 | 0.344 |
0.422 0.374 | 0.463 |
| 1 spectrum, QLFLEPEVLDPESVELK | 0.088 | 0.000 | 0.000 | 0.312 | 0.000 | 0.000 | 0.382 | 0.217 | ||
| 4 spectra, LDDFFK | 0.000 | 0.000 | 0.000 | 0.055 | 0.066 | 0.000 | 0.285 | 0.594 | ||
| 1 spectrum, SYFGR | 0.096 | 0.232 | 0.000 | 0.000 | 0.000 | 0.430 | 0.242 | 0.000 | ||
| 1 spectrum, LIADVAPSAIR | 0.000 | 0.000 | 0.000 | 0.307 | 0.000 | 0.000 | 0.273 | 0.420 |
| Plot | Lyso | Other | |||||||||||
| Expt C |
3 peptides |
6 spectra |
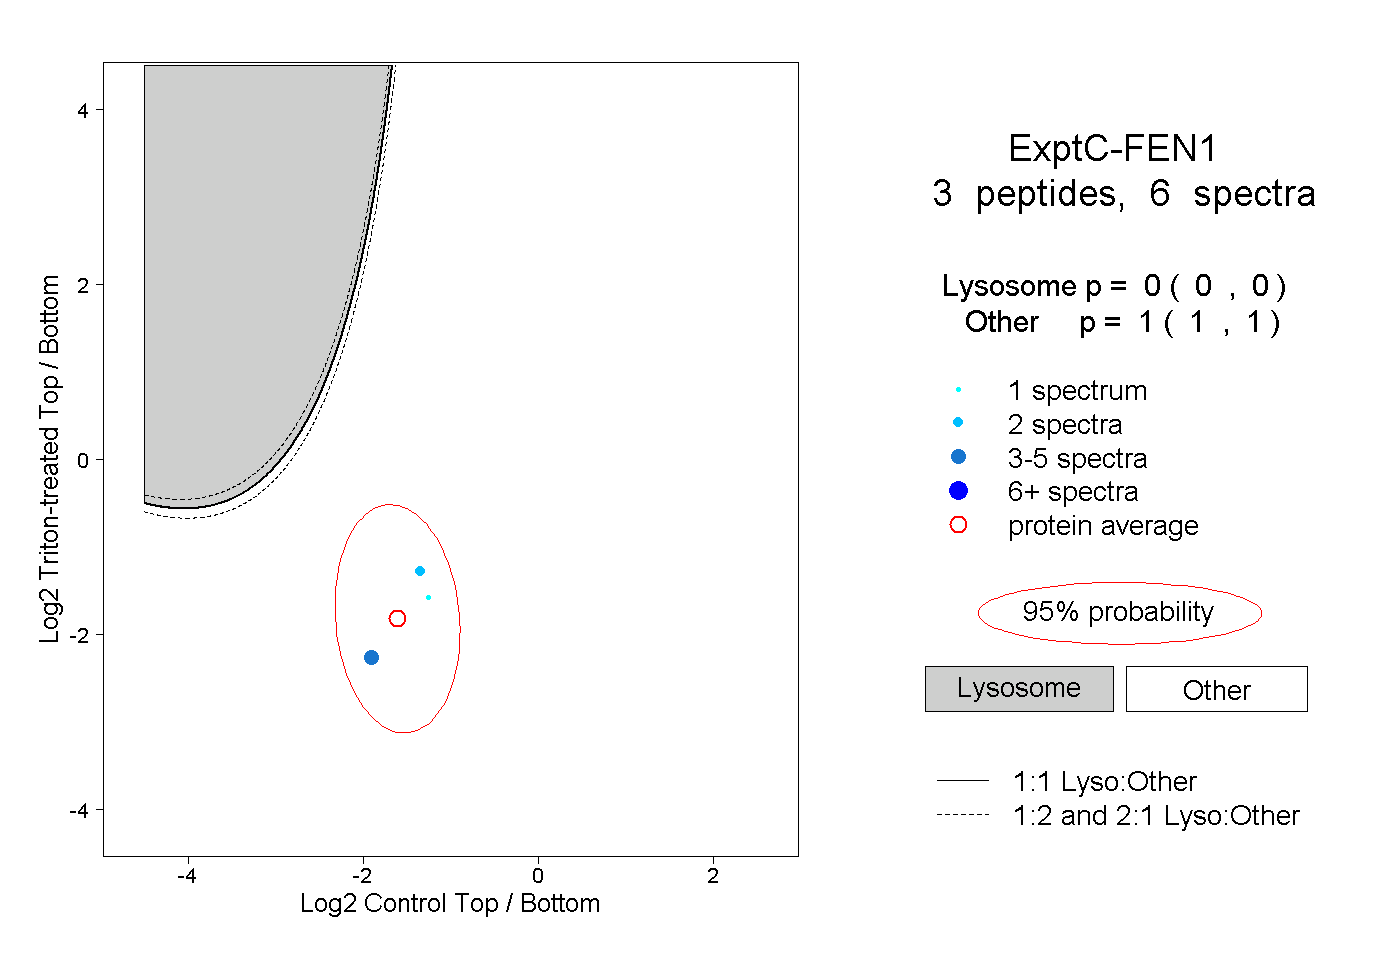 |
0.000 0.000 | 0.000 |
1.000 1.000 | 1.000 |
||||||||
| Plot | Lyso | Other | |||||||||||
| Expt D |
1 peptide |
1 spectrum |
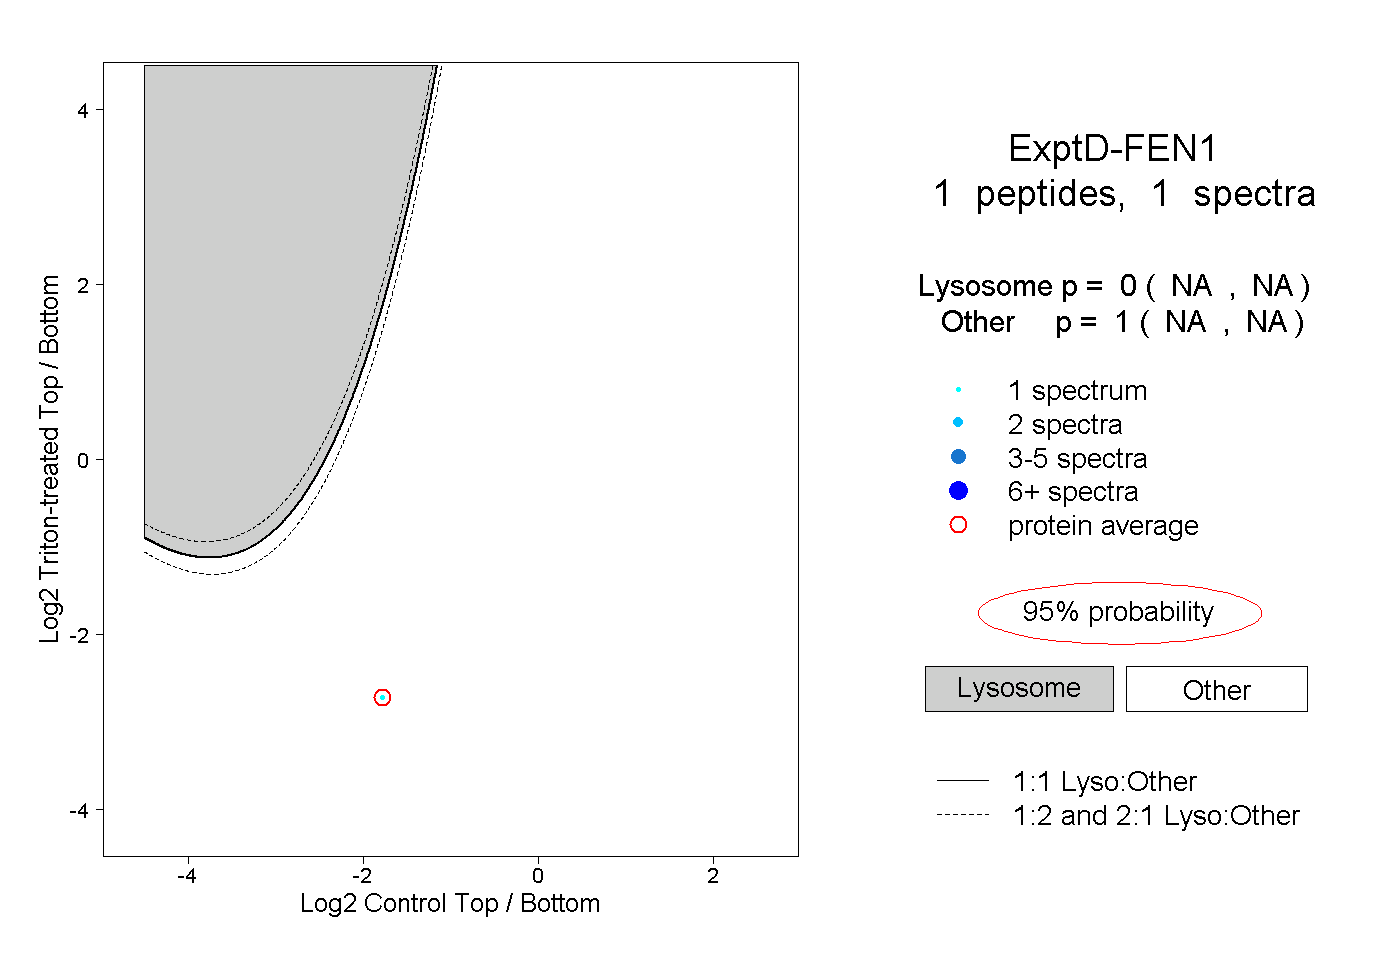 |
0.000 NA | NA |
1.000 NA | NA |