 4
4peptides
spectra
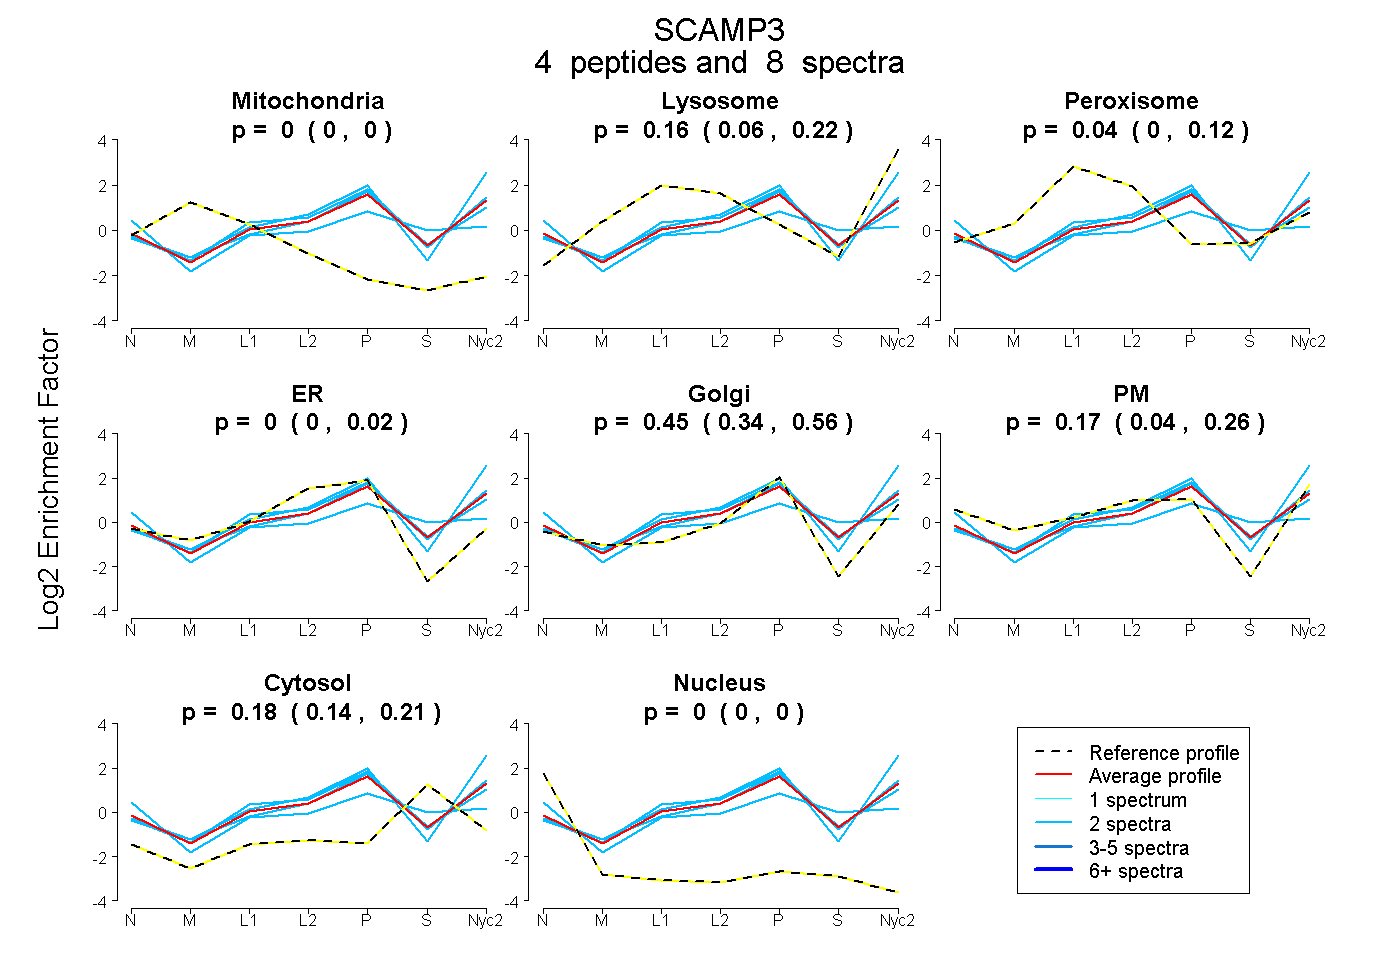
0.000 | 0.000
0.057 | 0.223
0.000 | 0.120
0.000 | 0.017
0.338 | 0.556
0.037 | 0.262
0.145 | 0.209
0.000 | 0.000
4peptides
spectra
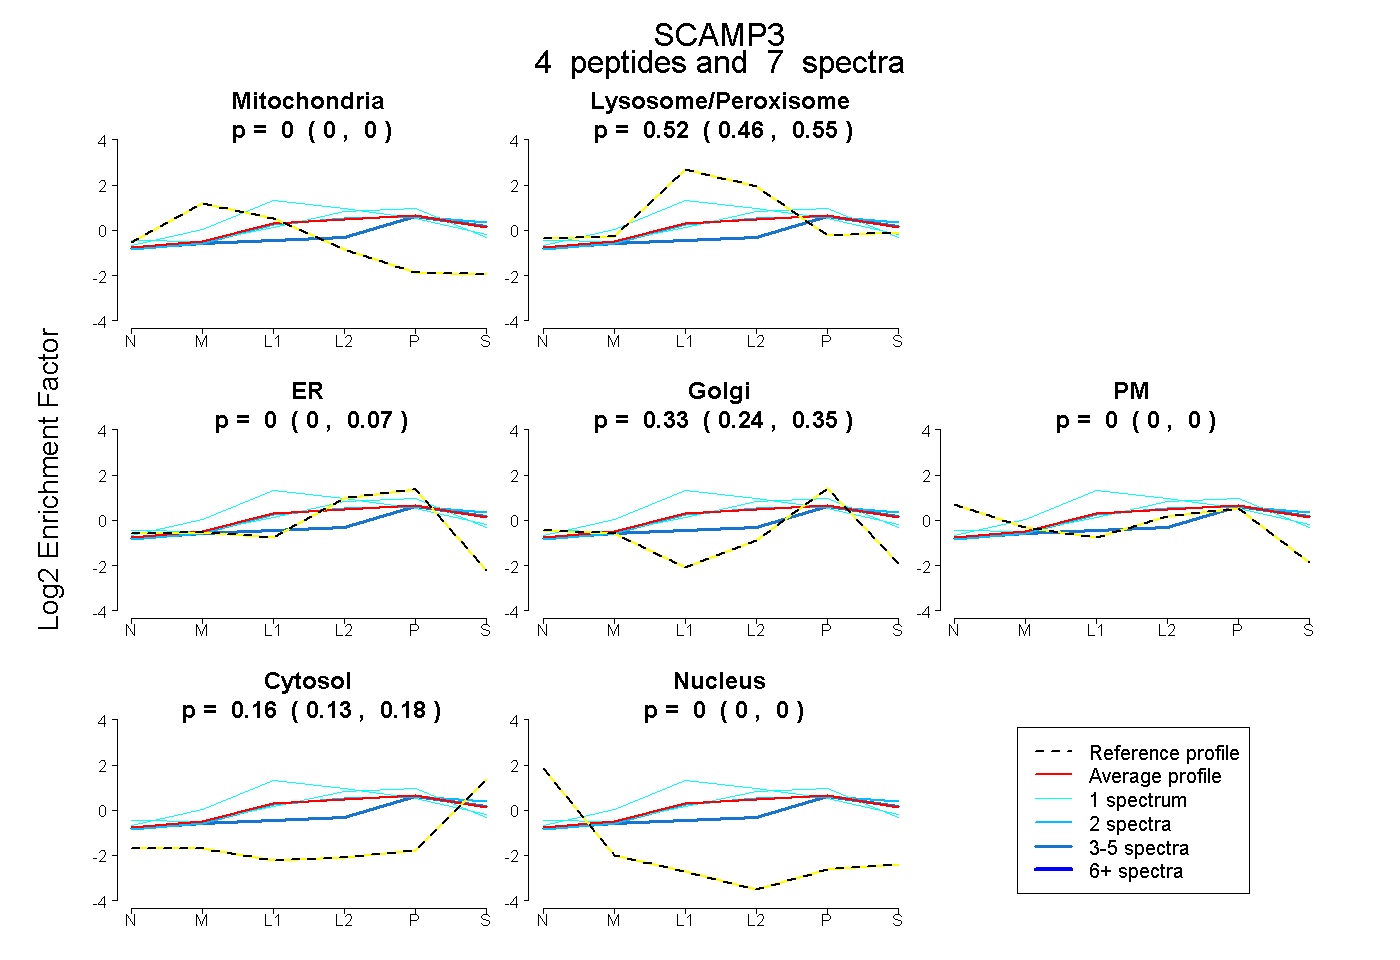
0.000 | 0.000
0.464 | 0.552
0.000 | 0.070
0.243 | 0.351
0.000 | 0.000
0.133 | 0.183
0.000 | 0.000
5peptides
spectra
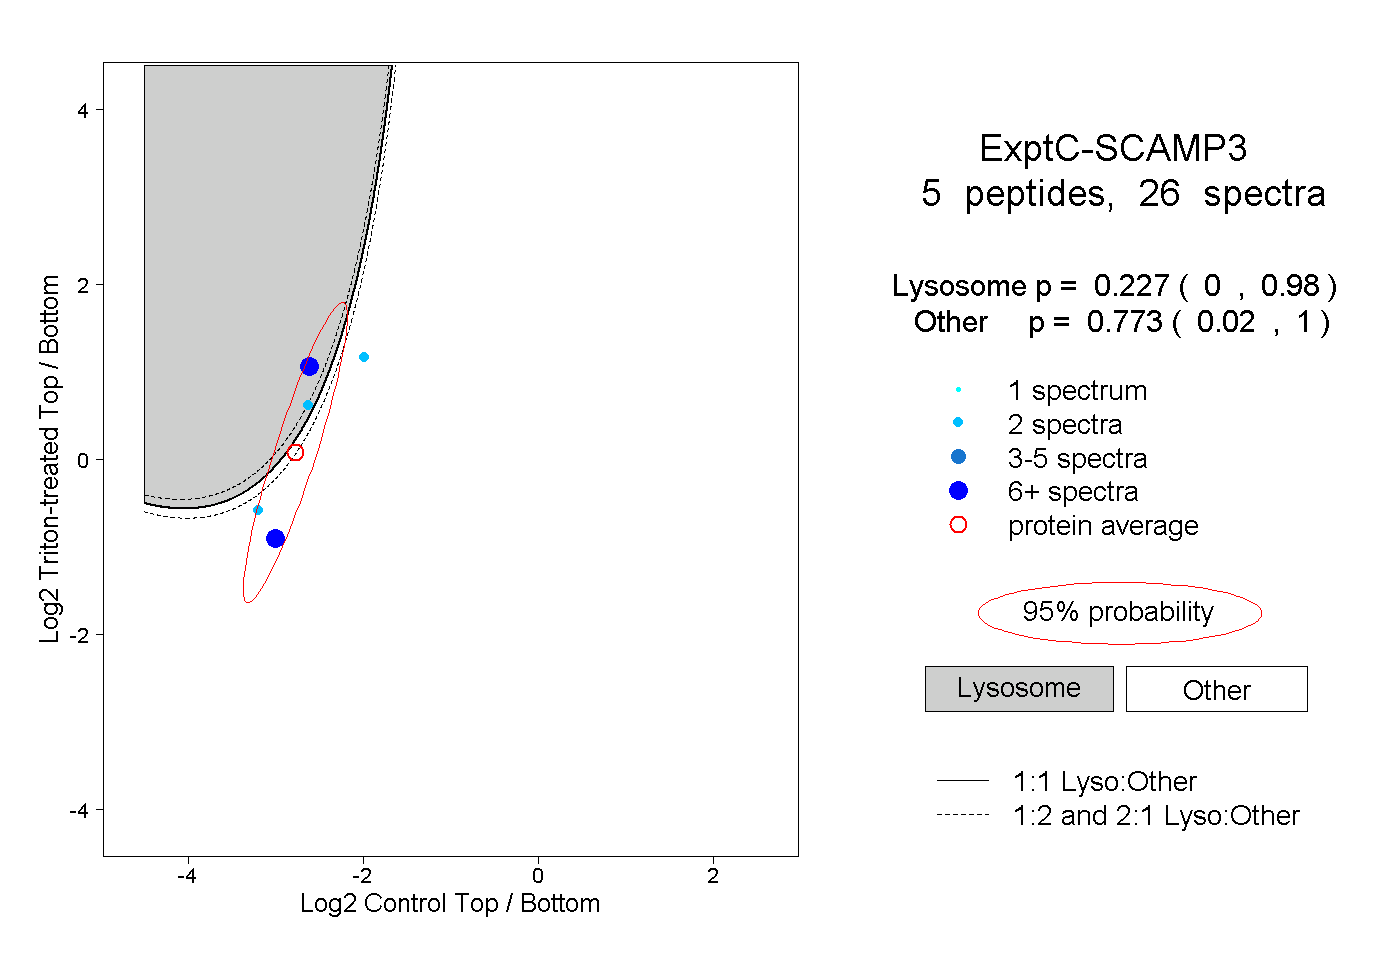
0.000 | 0.980
0.020 | 1.000
1peptide
spectrum
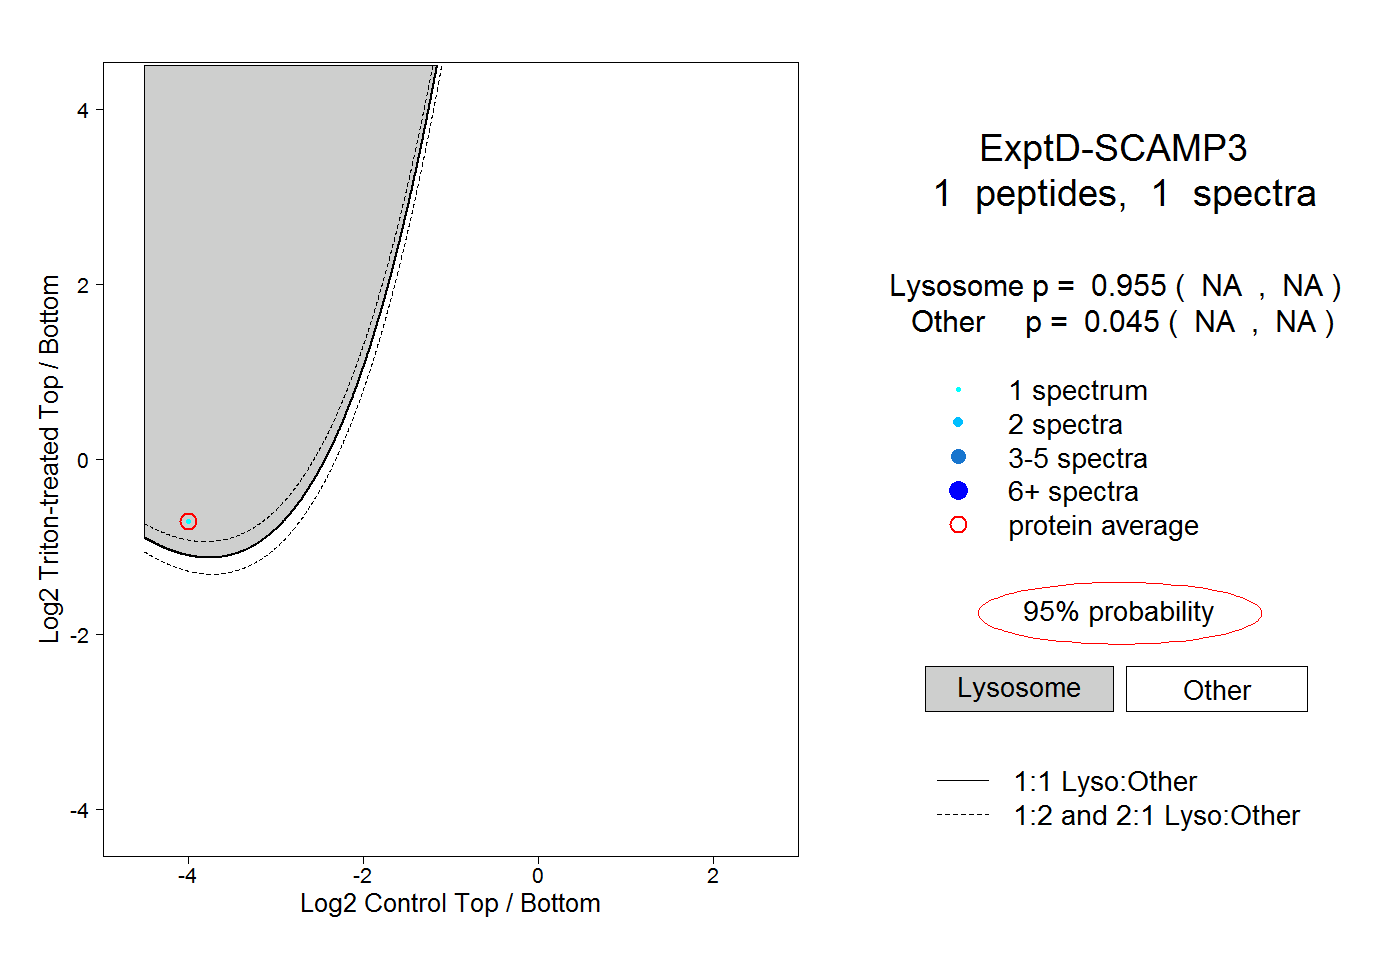
NA | NA
NA | NA