 3
3peptides
spectra
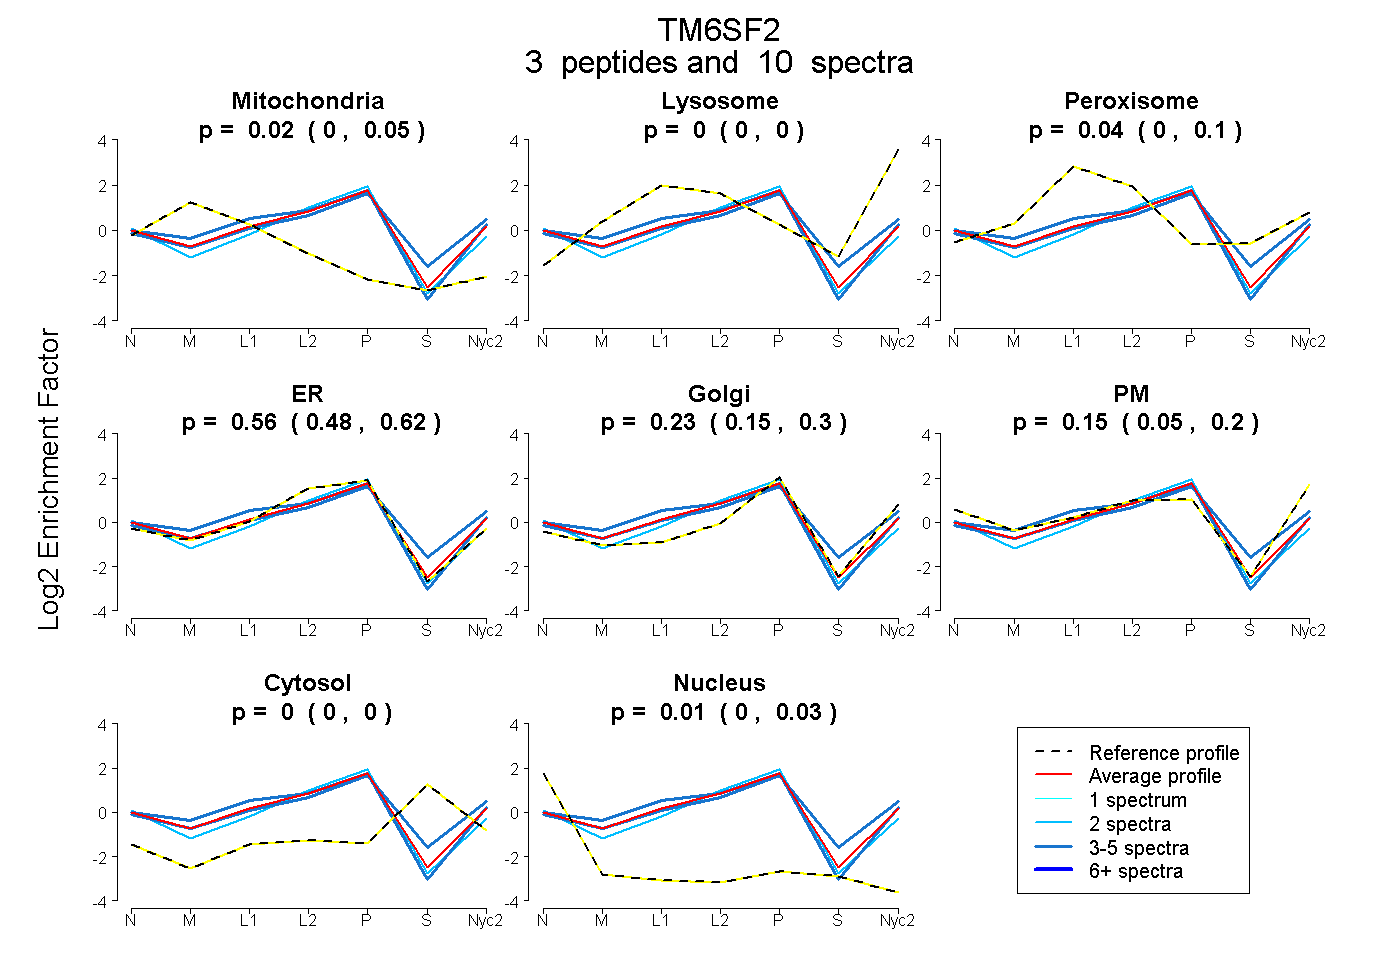
0.000 | 0.051
0.000 | 0.000
0.000 | 0.097
0.479 | 0.617
0.153 | 0.303
0.054 | 0.202
0.000 | 0.000
0.000 | 0.025
3peptides
spectra

0.000 | 0.000
0.039 | 0.204
0.430 | 0.721
0.071 | 0.326
0.000 | 0.132
0.000 | 0.000
0.000 | 0.000
4peptides
spectra
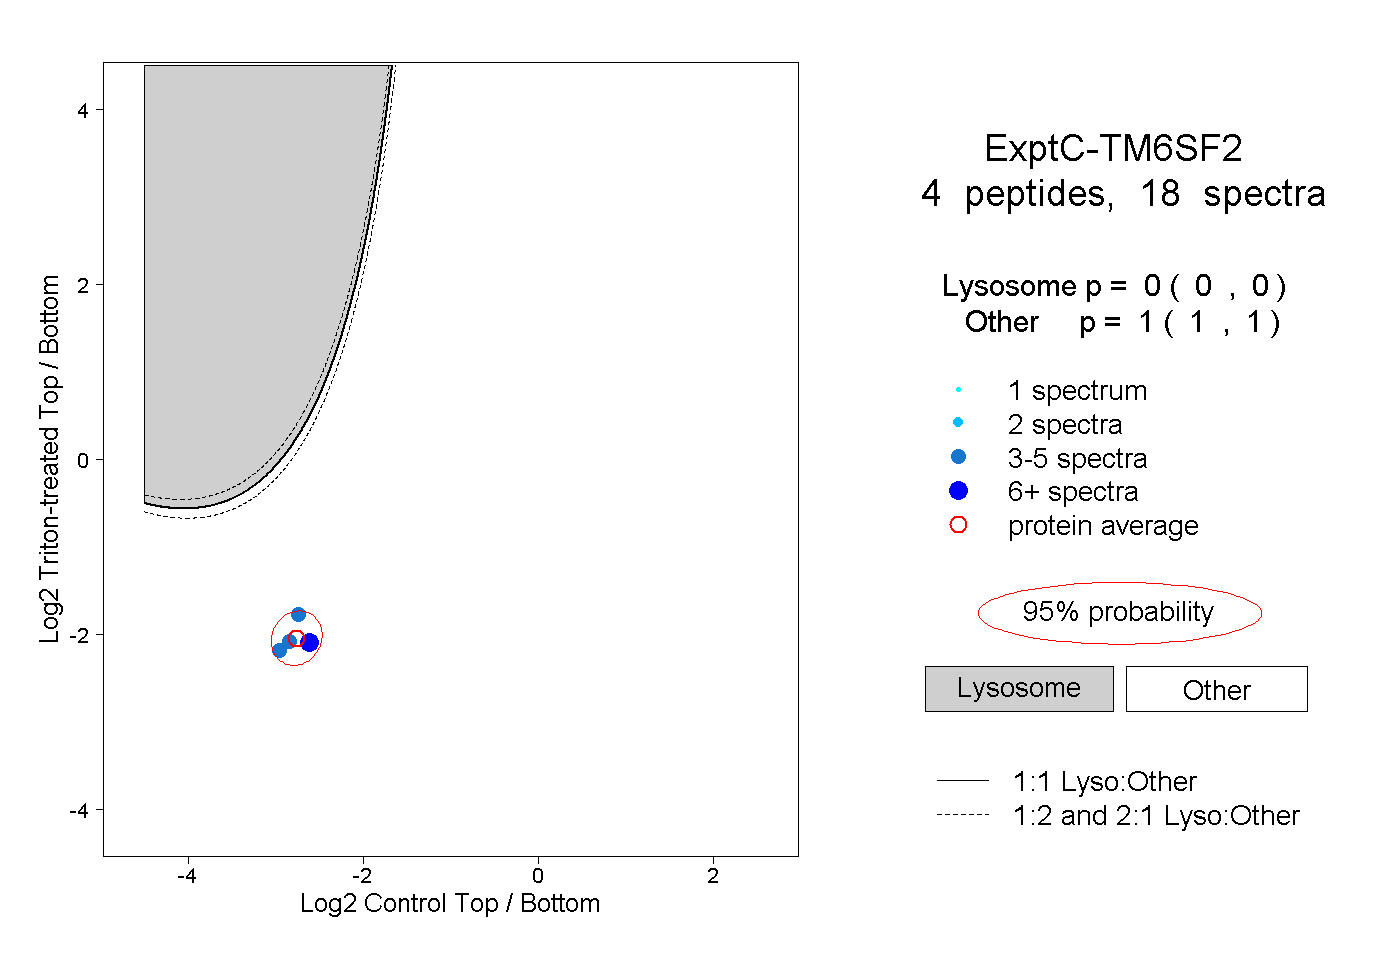
0.000 | 0.000
1.000 | 1.000
1peptide
spectra
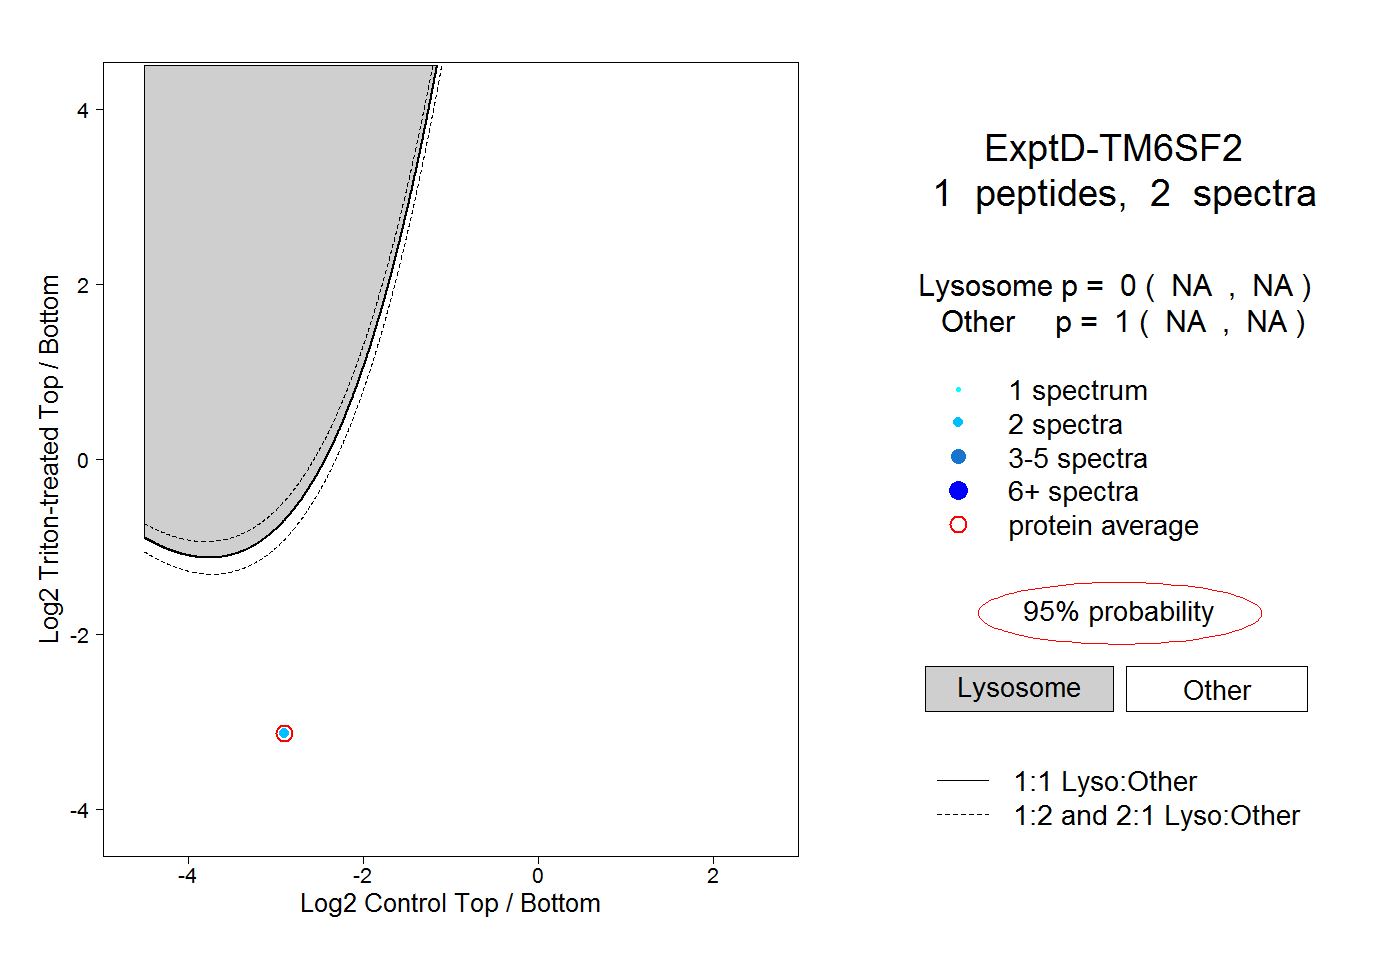
NA | NA
NA | NA