 6
6peptides
spectra
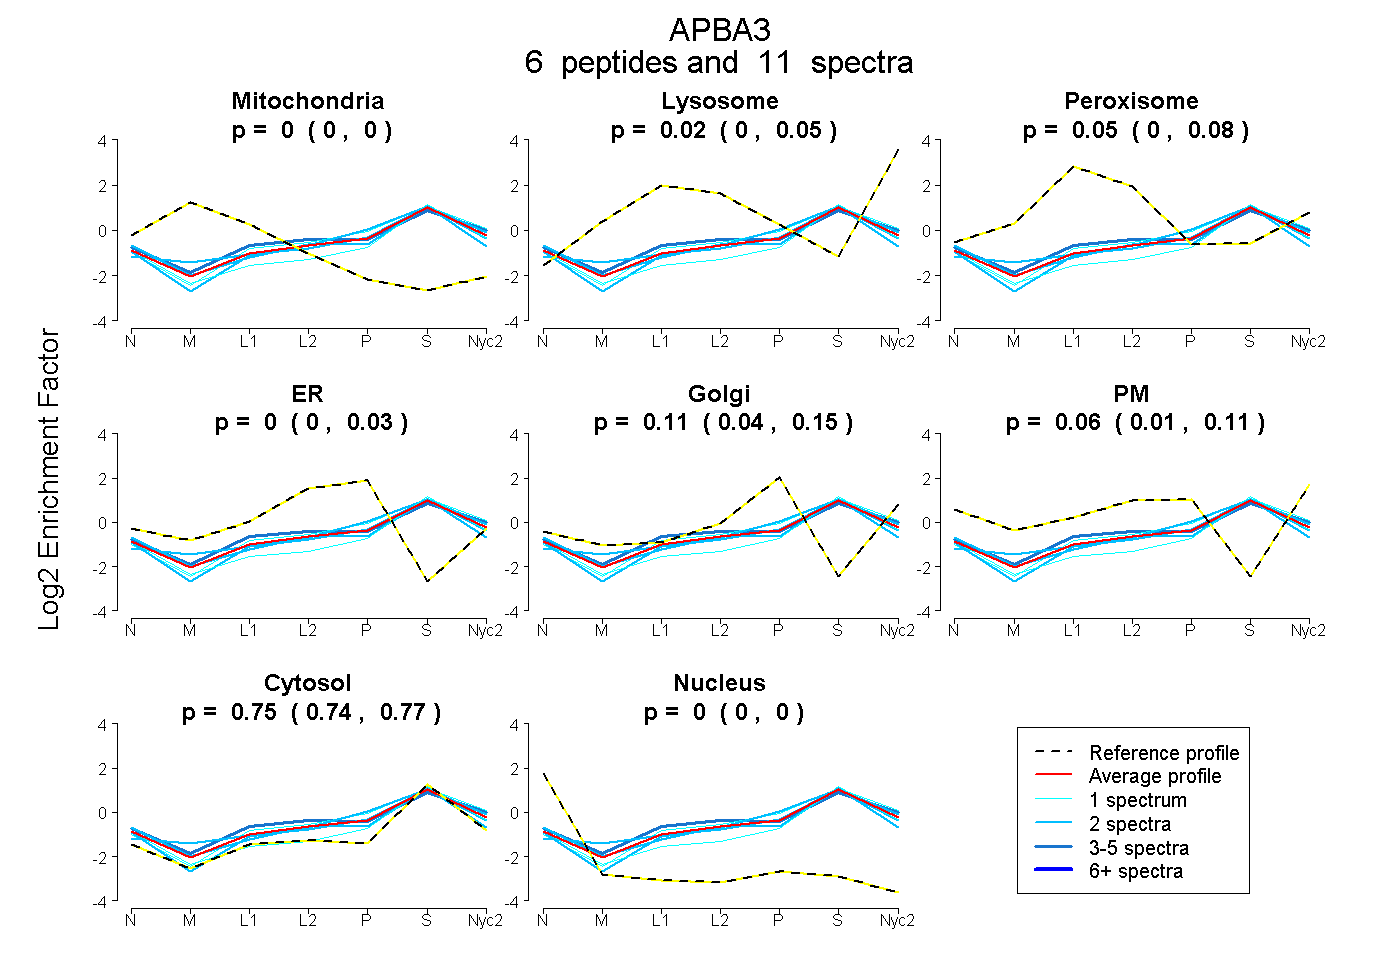
0.000 | 0.000
0.000 | 0.045
0.001 | 0.079
0.000 | 0.026
0.045 | 0.151
0.005 | 0.113
0.736 | 0.774
0.000 | 0.000
1peptide
spectra
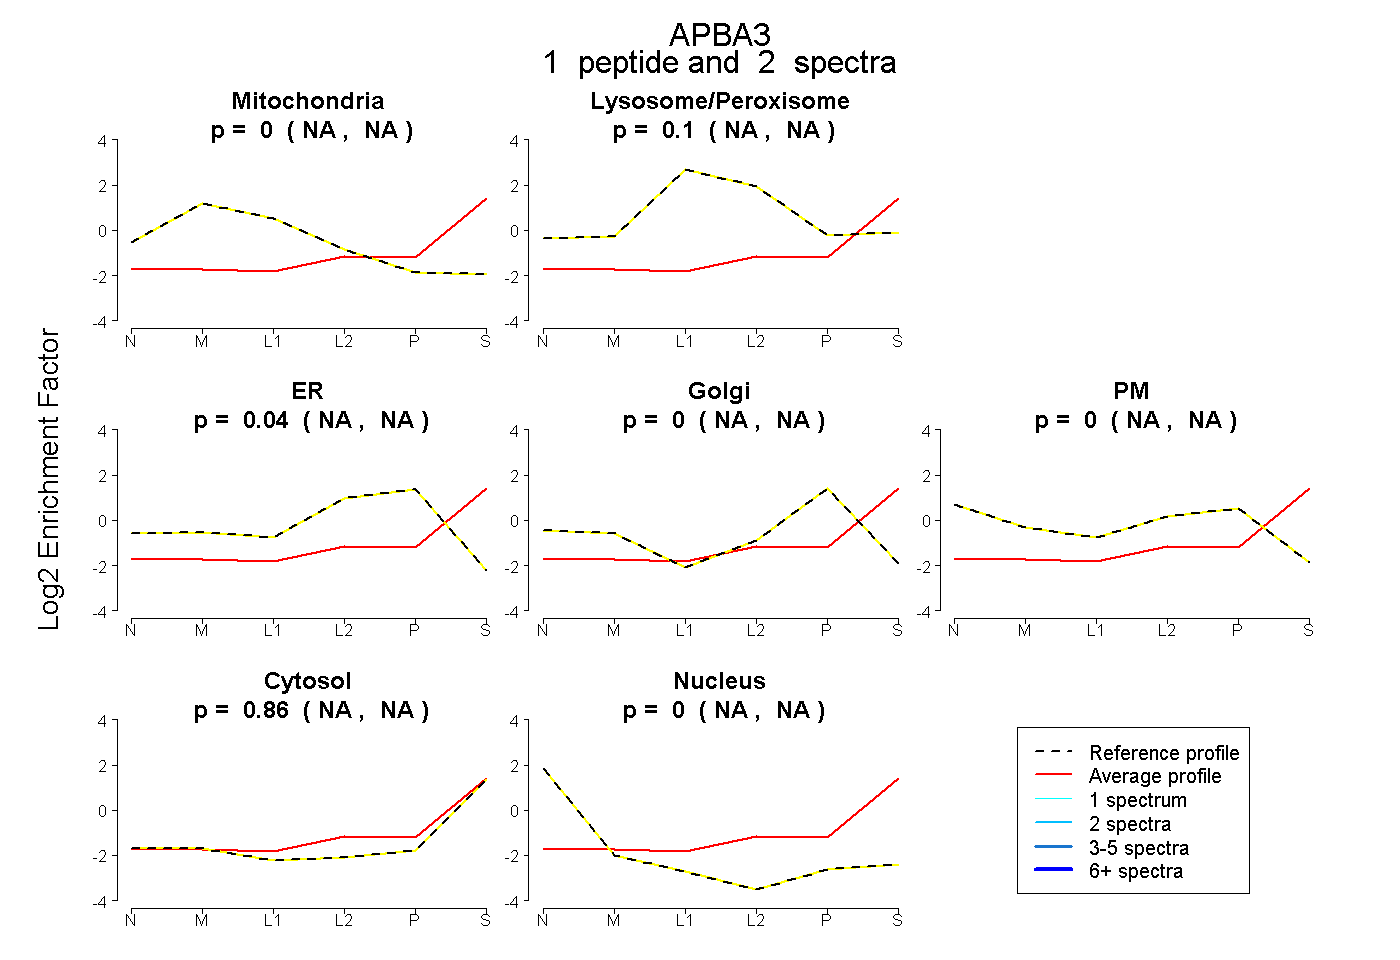
NA | NA
NA | NA
NA | NA
NA | NA
NA | NA
NA | NA
NA | NA
1peptide
spectra
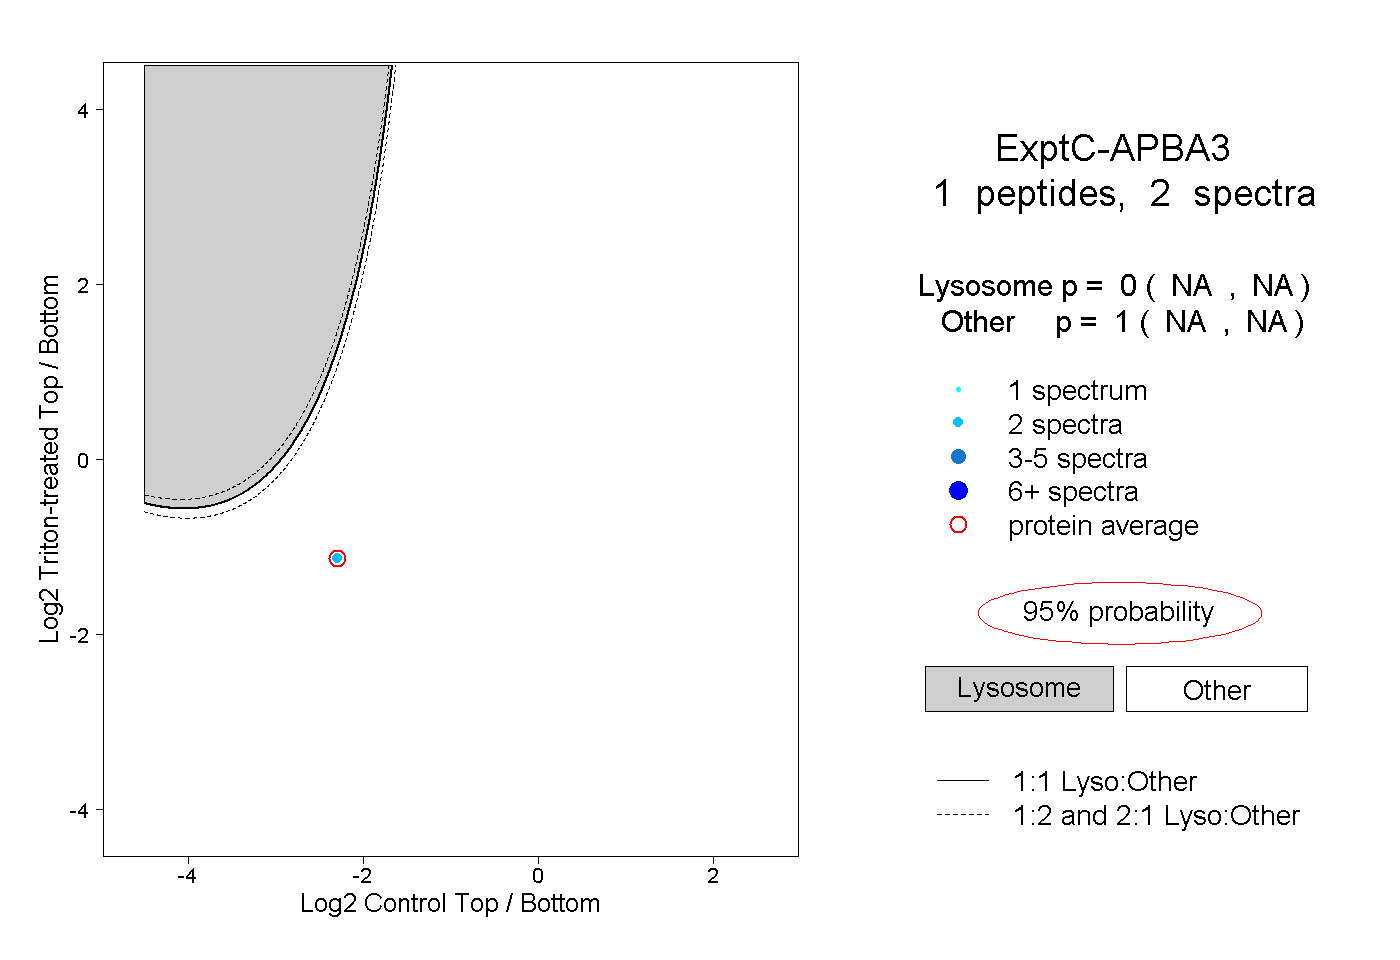
NA | NA
NA | NA