 1
1peptide
spectra
0.000 | 0.000
0.000 | 0.091
0.000 | 0.028
0.000 | 0.465
0.000 | 0.262
0.296 | 0.644
0.000 | 0.279
0.000 | 0.042
1peptide
spectrum
NA | NA
NA | NA
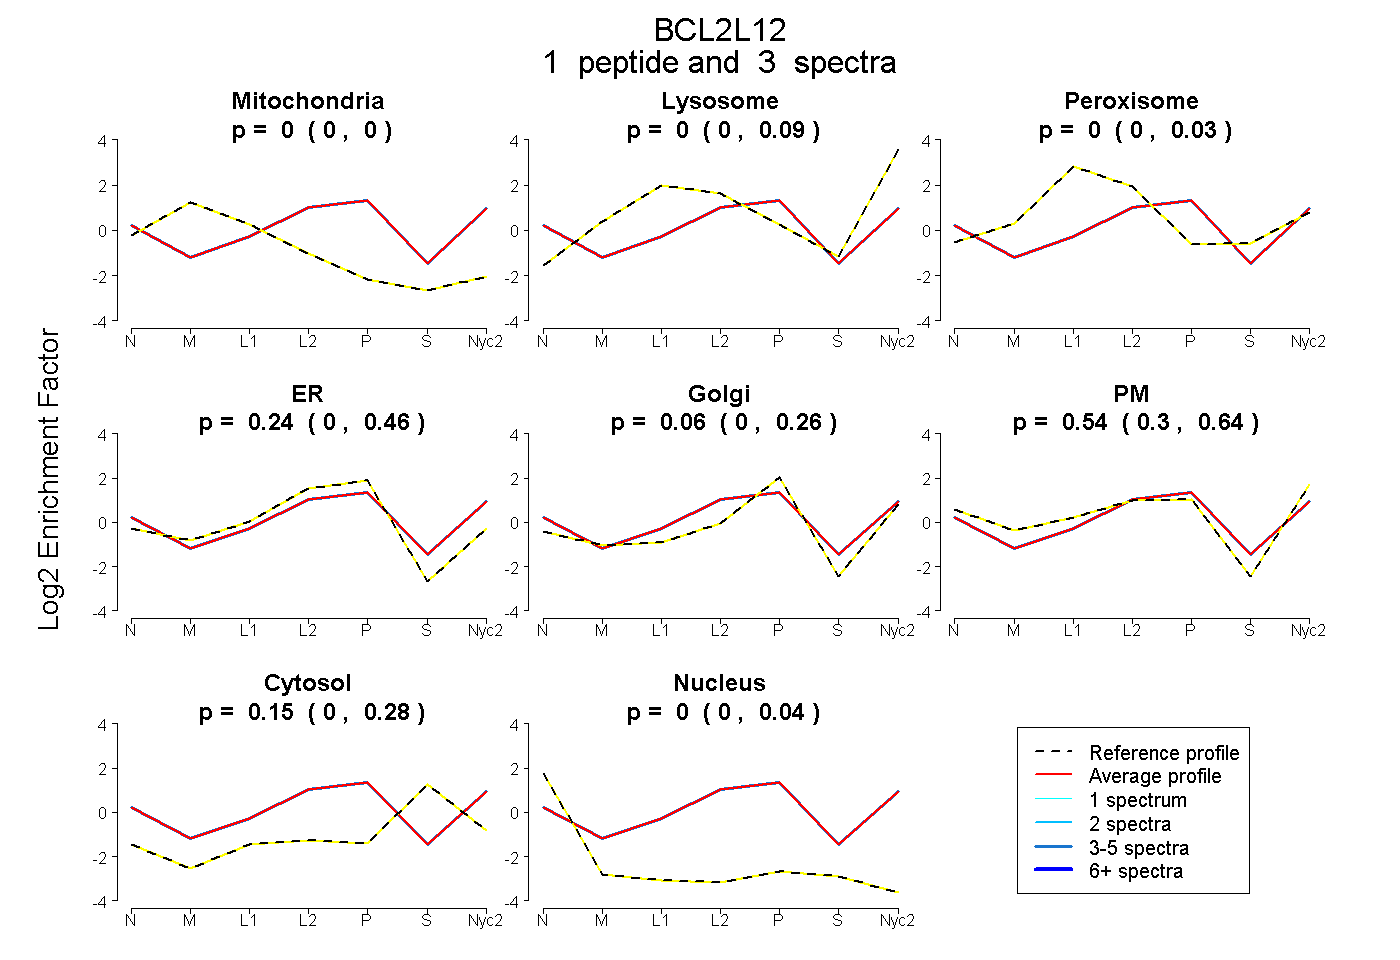
| Plot | Mito | Lyso | Perox | ER | Golgi | PM | Cytosol | Nucleus | |||||
| Expt A |
1 peptide |
3 spectra |
|
0.000 0.000 | 0.000 |
0.000 0.000 | 0.091 |
0.000 0.000 | 0.028 |
0.244 0.000 | 0.465 |
0.065 0.000 | 0.262 |
0.537 0.296 | 0.644 |
0.154 0.000 | 0.279 |
0.000 0.000 | 0.042 |
||
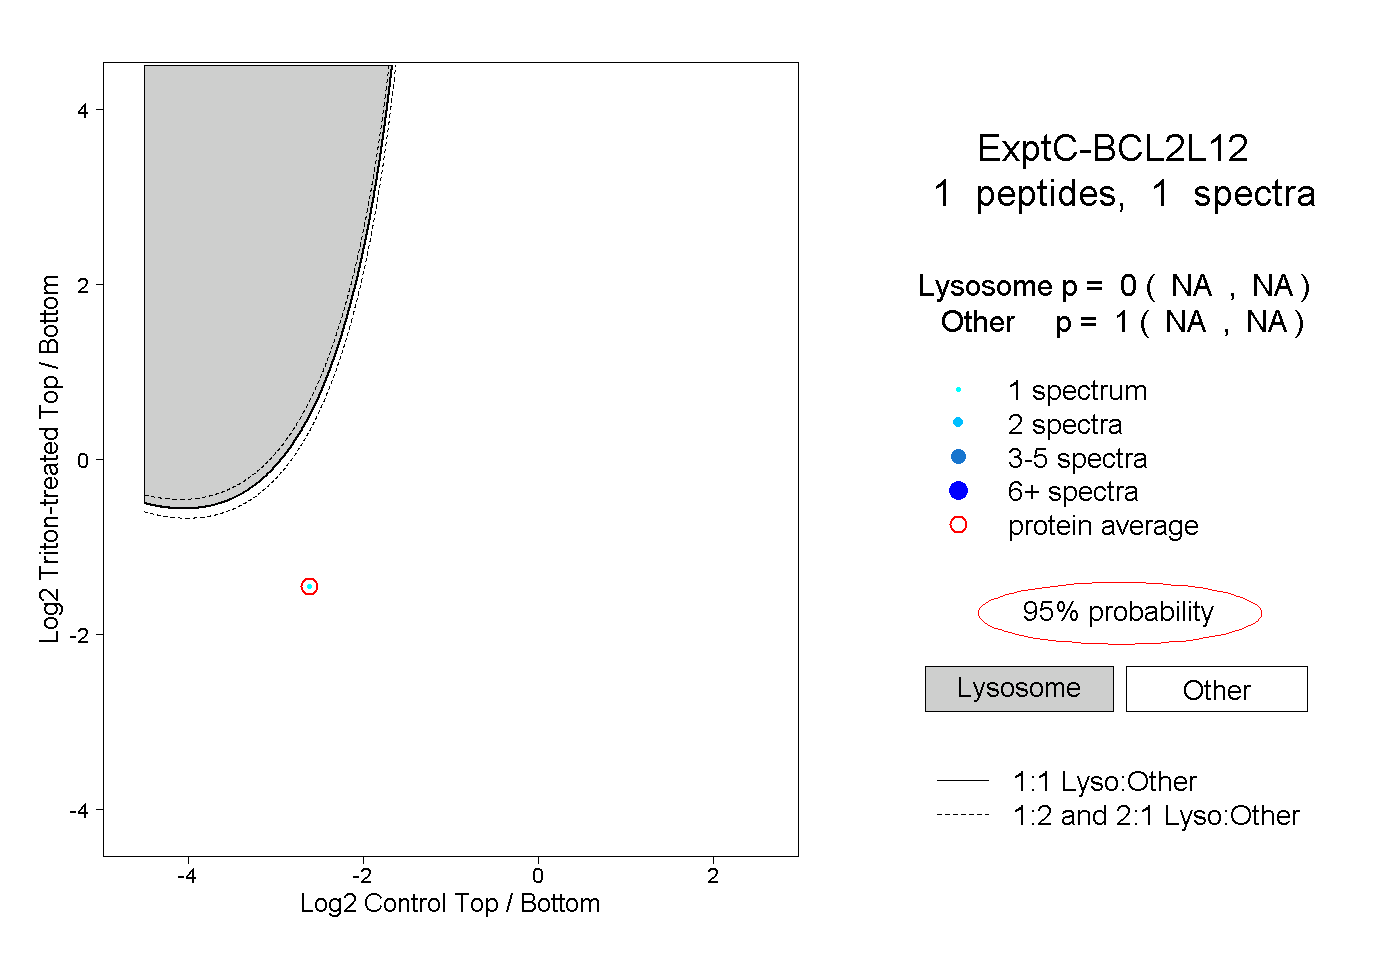
| Plot | Lyso | Other | |||||||||||
| Expt C |
1 peptide |
1 spectrum |
|
0.000 NA | NA |
1.000 NA | NA |