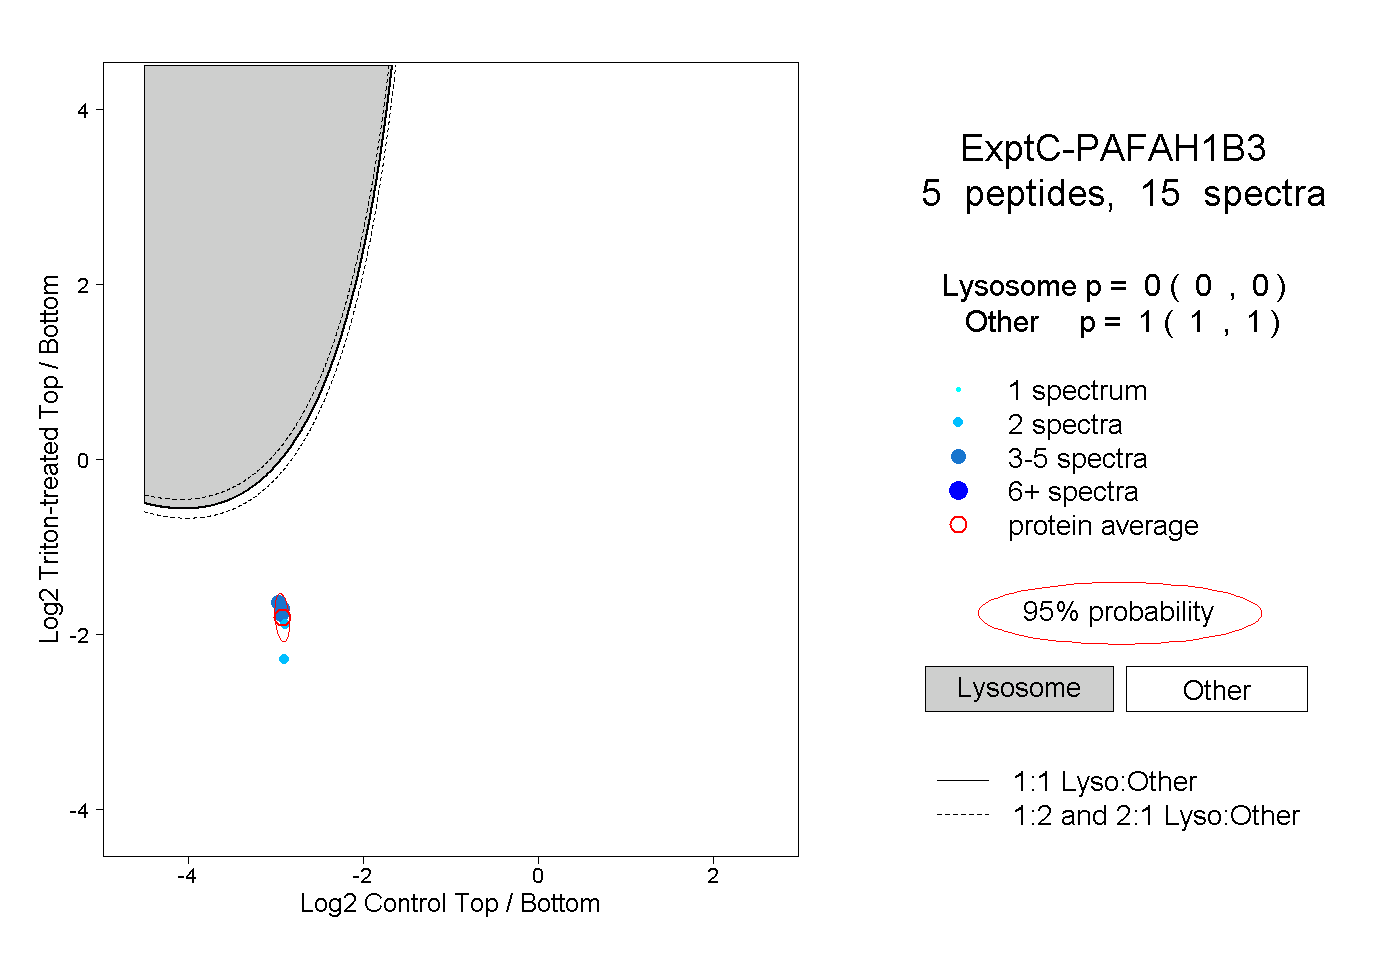
PAFAH1B3
[ENSRNOP00000027774]
Main page
| | | Plot |
Mito |
Lyso |
|
Perox |
ER |
Golgi |
PM |
Cytosol |
Nucleus |
|
| Expt A |
 5
5
peptides |
17
spectra |
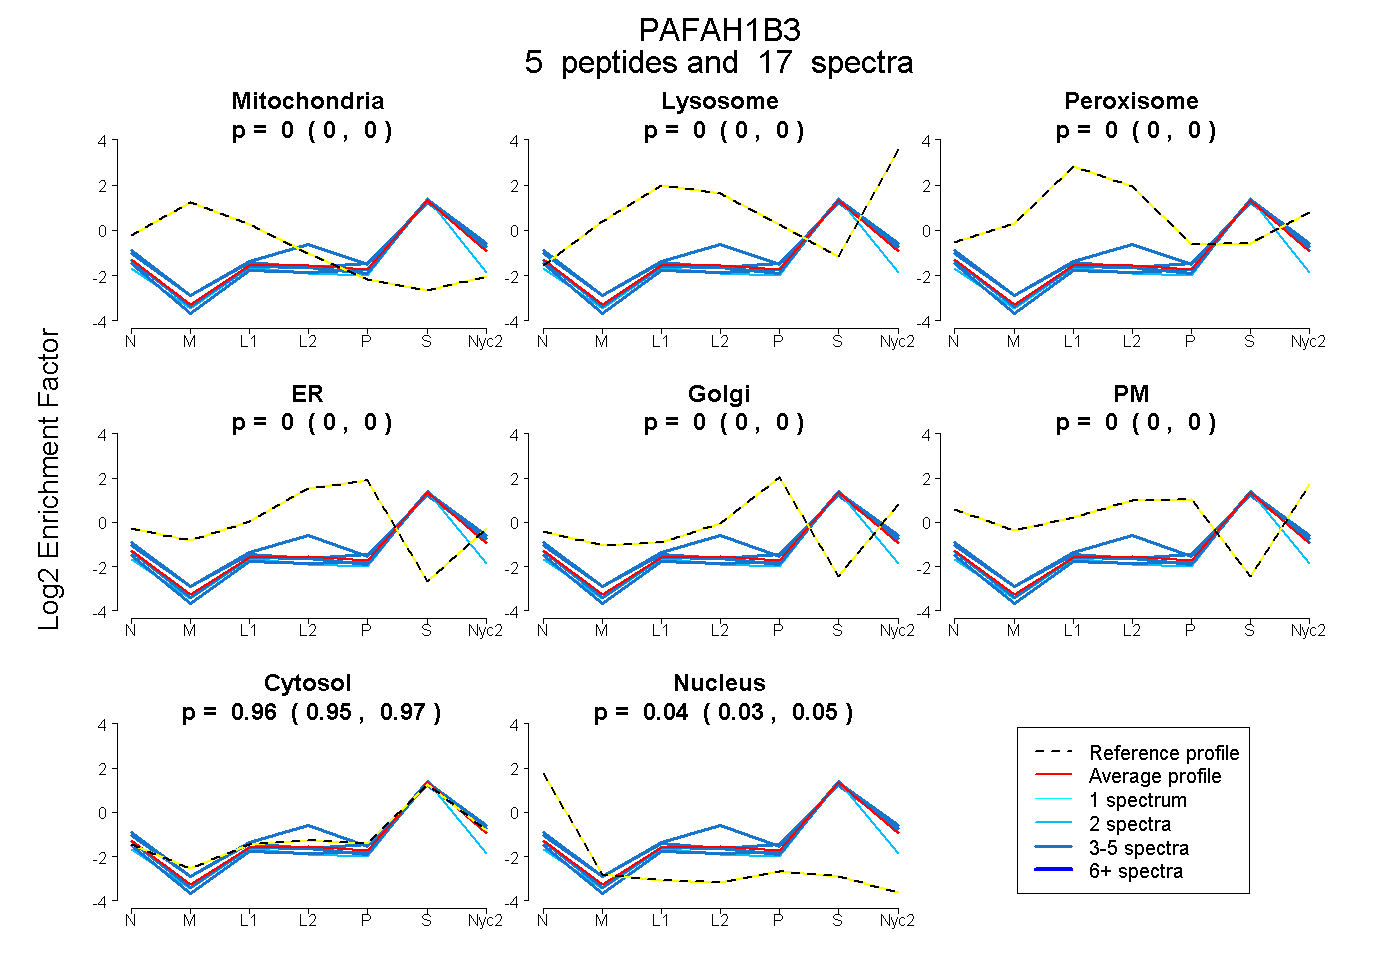 |
0.000
0.000 | 0.000 |
0.000
0.000 | 0.000 |
|
0.000
0.000 | 0.000 |
0.000
0.000 | 0.000 |
0.000
0.000 | 0.000 |
0.000
0.000 | 0.000 |
0.959
0.949 | 0.968 |
0.041
0.031 | 0.050 |
|
| | | Plot |
Mito |
|
Lyso or Perox |
|
ER |
Golgi |
PM |
Cytosol |
Nucleus |
|
| Expt B |
6
peptides |
7
spectra |
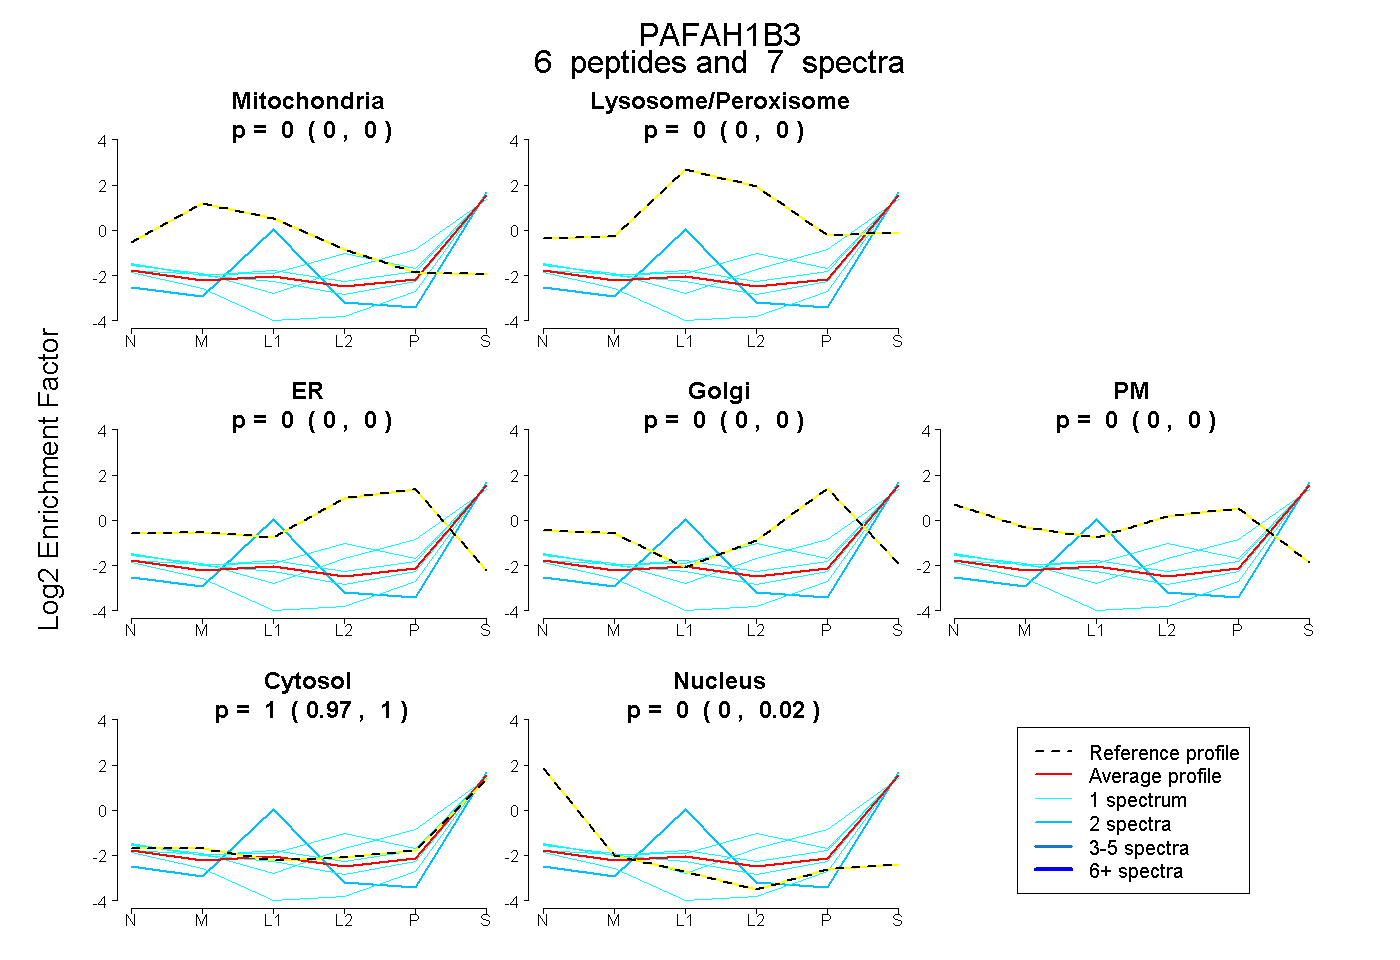 |
0.000
0.000 | 0.000 |
|
0.000
0.000 | 0.000 |
|
0.000
0.000 | 0.000 |
0.000
0.000 | 0.000 |
0.000
0.000 | 0.000 |
0.997
0.975 | 1.000 |
0.003
0.000 | 0.021 |
|
| 1 spectrum, LQPQAR |
0.000 |
|
0.021 |
|
0.000 |
0.000 |
0.000 |
0.963 |
0.016 |
|
| 2 spectra, ALHSLLLR |
0.000 |
|
0.021 |
|
0.000 |
0.000 |
0.000 |
0.979 |
0.000 |
|
| 1 spectrum, VVVLGLLPR |
0.000 |
|
0.000 |
|
0.000 |
0.000 |
0.000 |
0.904 |
0.096 |
|
| 1 spectrum, QVNELVR |
0.000 |
|
0.000 |
|
0.000 |
0.125 |
0.000 |
0.875 |
0.000 |
|
| 1 spectrum, LGYTPVCR |
0.000 |
|
0.000 |
|
0.000 |
0.000 |
0.000 |
0.936 |
0.064 |
|
| 1 spectrum, LENGELEHIRPK |
0.000 |
|
0.105 |
|
0.000 |
0.000 |
0.000 |
0.895 |
0.000 |
|
| | | Plot |
|
Lyso |
|
|
|
|
|
|
|
Other |
| Expt C |
5
peptides |
15
spectra |
 |
|
0.000
0.000 | 0.000 |
|
|
|
|
|
|
|
1.000
1.000 | 1.000 |