 5
5peptides
spectra
0.000 | 0.000
0.000 | 0.000
0.000 | 0.000
0.000 | 0.000
0.000 | 0.000
0.000 | 0.000
0.949 | 0.968
0.031 | 0.050
| Plot | Mito | Lyso | Perox | ER | Golgi | PM | Cytosol | Nucleus | |||||
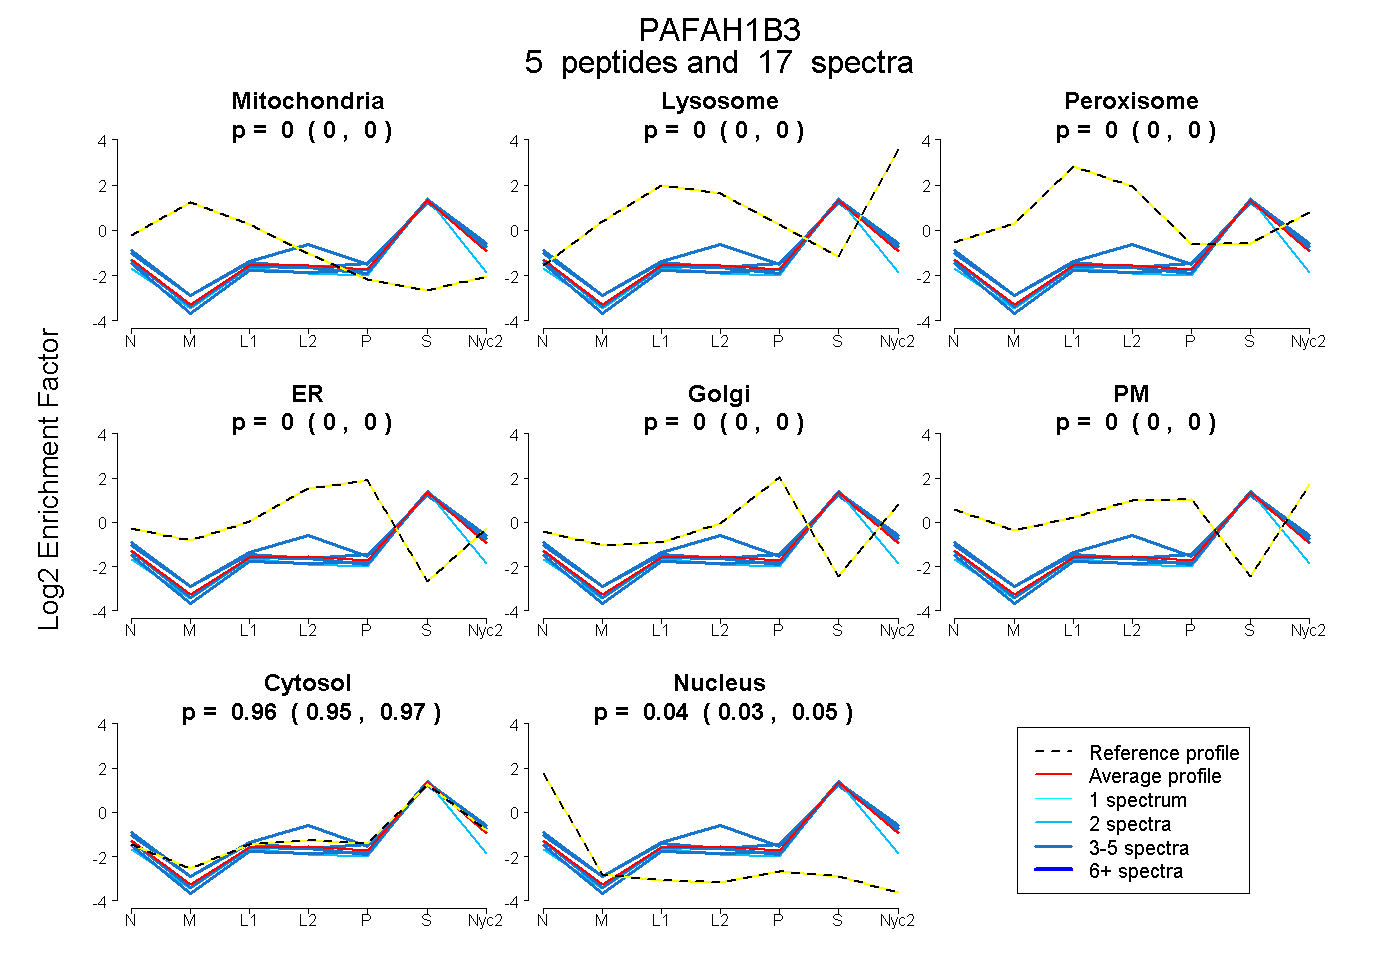
| Expt A |
5 peptides |
17 spectra |
|
0.000 0.000 | 0.000 |
0.000 0.000 | 0.000 |
0.000 0.000 | 0.000 |
0.000 0.000 | 0.000 |
0.000 0.000 | 0.000 |
0.000 0.000 | 0.000 |
0.959 0.949 | 0.968 |
0.041 0.031 | 0.050 |
| 4 spectra, LQPQAR | 0.000 | 0.000 | 0.000 | 0.000 | 0.000 | 0.000 | 0.958 | 0.042 | ||
| 3 spectra, ALHSLLLR | 0.000 | 0.000 | 0.040 | 0.000 | 0.000 | 0.003 | 0.955 | 0.002 | ||
| 3 spectra, AALAGYPR | 0.000 | 0.000 | 0.000 | 0.000 | 0.000 | 0.000 | 0.947 | 0.053 | ||
| 5 spectra, VVVLGLLPR | 0.000 | 0.000 | 0.000 | 0.000 | 0.000 | 0.000 | 0.976 | 0.024 | ||
| 2 spectra, LGYTPVCR | 0.000 | 0.000 | 0.000 | 0.000 | 0.000 | 0.000 | 0.909 | 0.091 |
| Plot | Mito | Lyso or Perox | ER | Golgi | PM | Cytosol | Nucleus | ||||||
| Expt B |
6 peptides |
7 spectra |
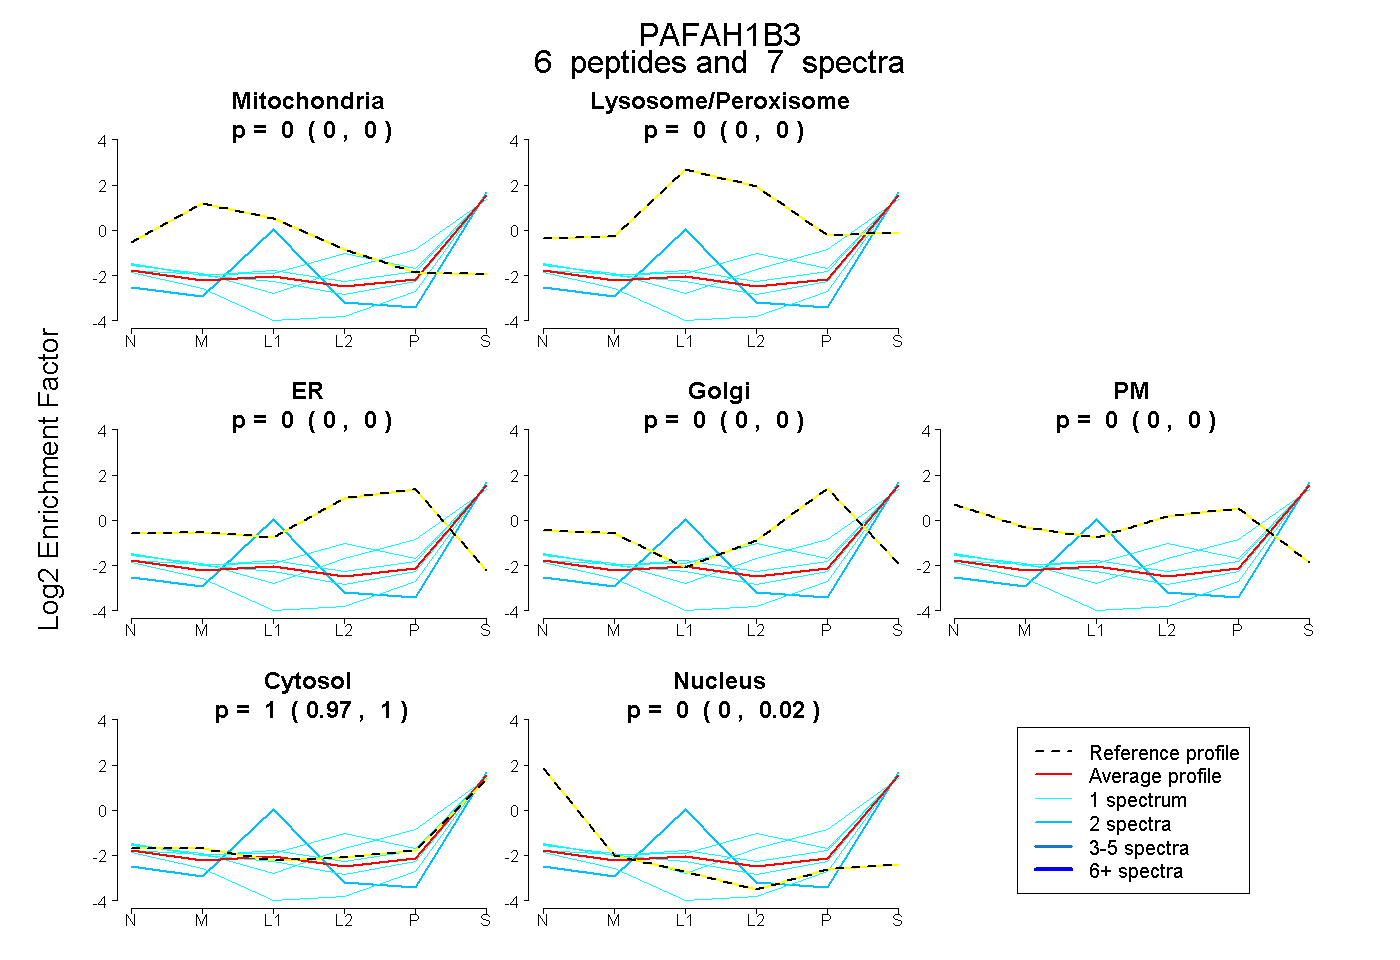 |
0.000 0.000 | 0.000 |
0.000 0.000 | 0.000 |
0.000 0.000 | 0.000 |
0.000 0.000 | 0.000 |
0.000 0.000 | 0.000 |
0.997 0.975 | 1.000 |
0.003 0.000 | 0.021 |
|||
| Plot | Lyso | Other | |||||||||||
| Expt C |
5 peptides |
15 spectra |
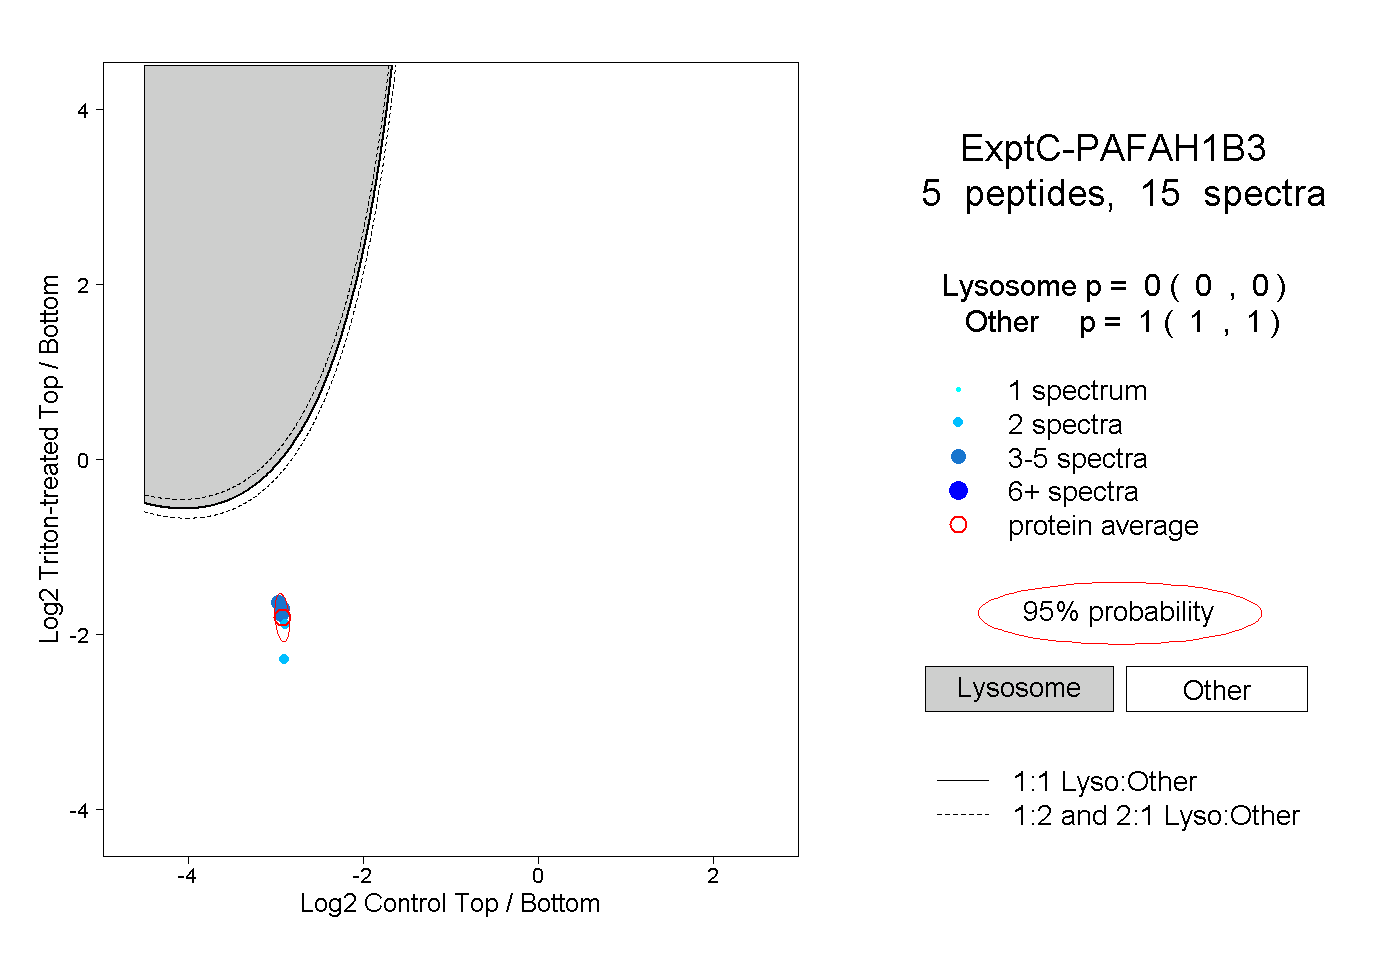 |
0.000 0.000 | 0.000 |
1.000 1.000 | 1.000 |