 6
6peptides
spectra
0.000 | 0.000
0.000 | 0.000
0.000 | 0.000
0.393 | 0.448
0.000 | 0.024
0.000 | 0.000
0.065 | 0.133
0.430 | 0.502
1peptide
spectrum
NA | NA
NA | NA
NA | NA
NA | NA
NA | NA
NA | NA
NA | NA
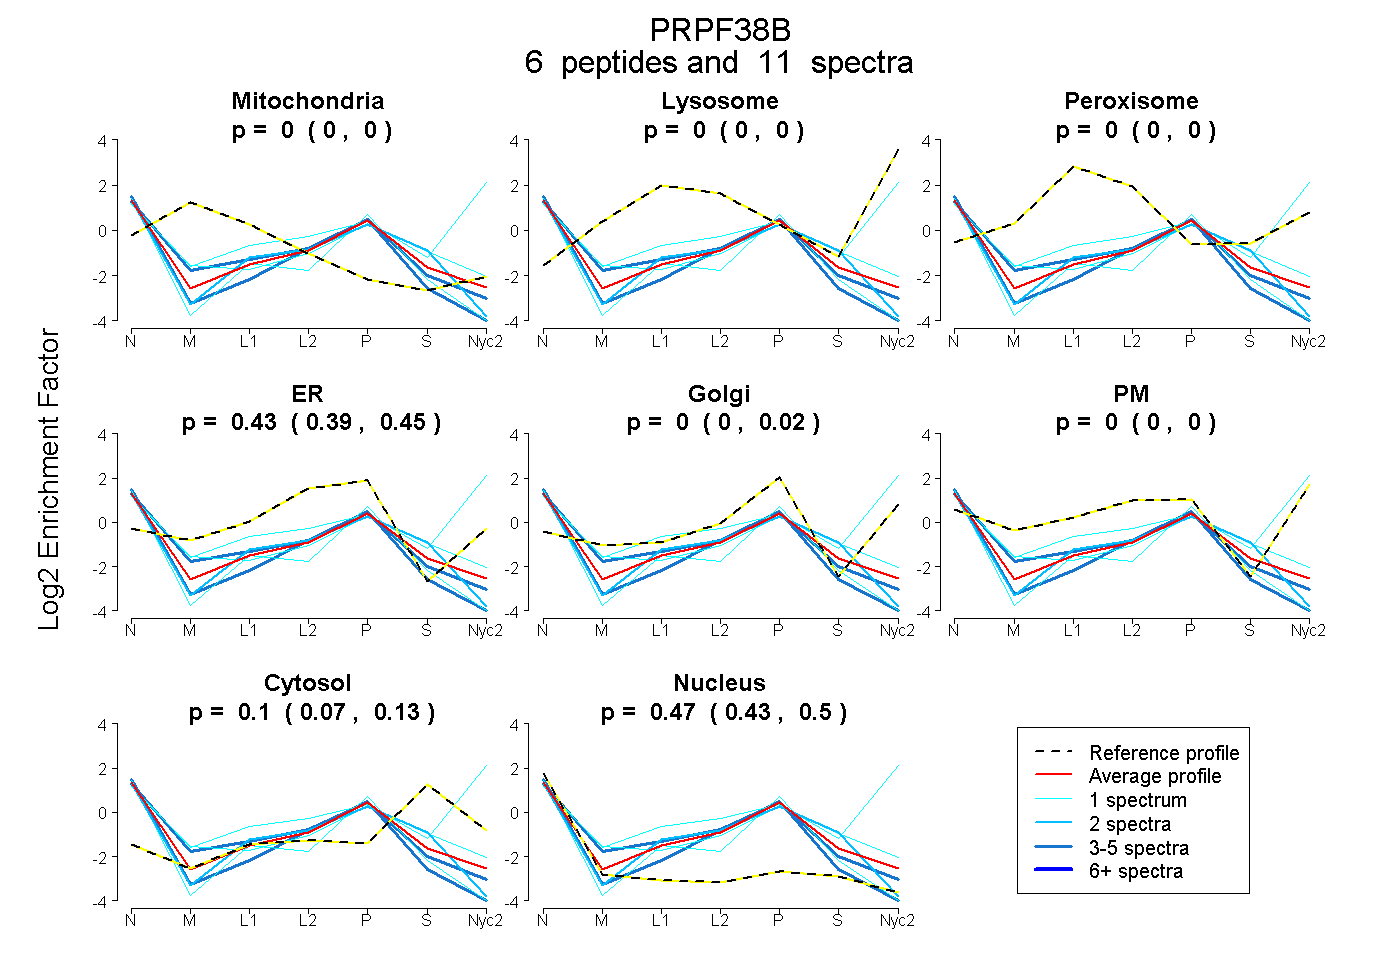
| Plot | Mito | Lyso | Perox | ER | Golgi | PM | Cytosol | Nucleus | |||||
| Expt A |
6 peptides |
11 spectra |
|
0.000 0.000 | 0.000 |
0.000 0.000 | 0.000 |
0.000 0.000 | 0.000 |
0.430 0.393 | 0.448 |
0.000 0.000 | 0.024 |
0.000 0.000 | 0.000 |
0.102 0.065 | 0.133 |
0.468 0.430 | 0.502 |
||
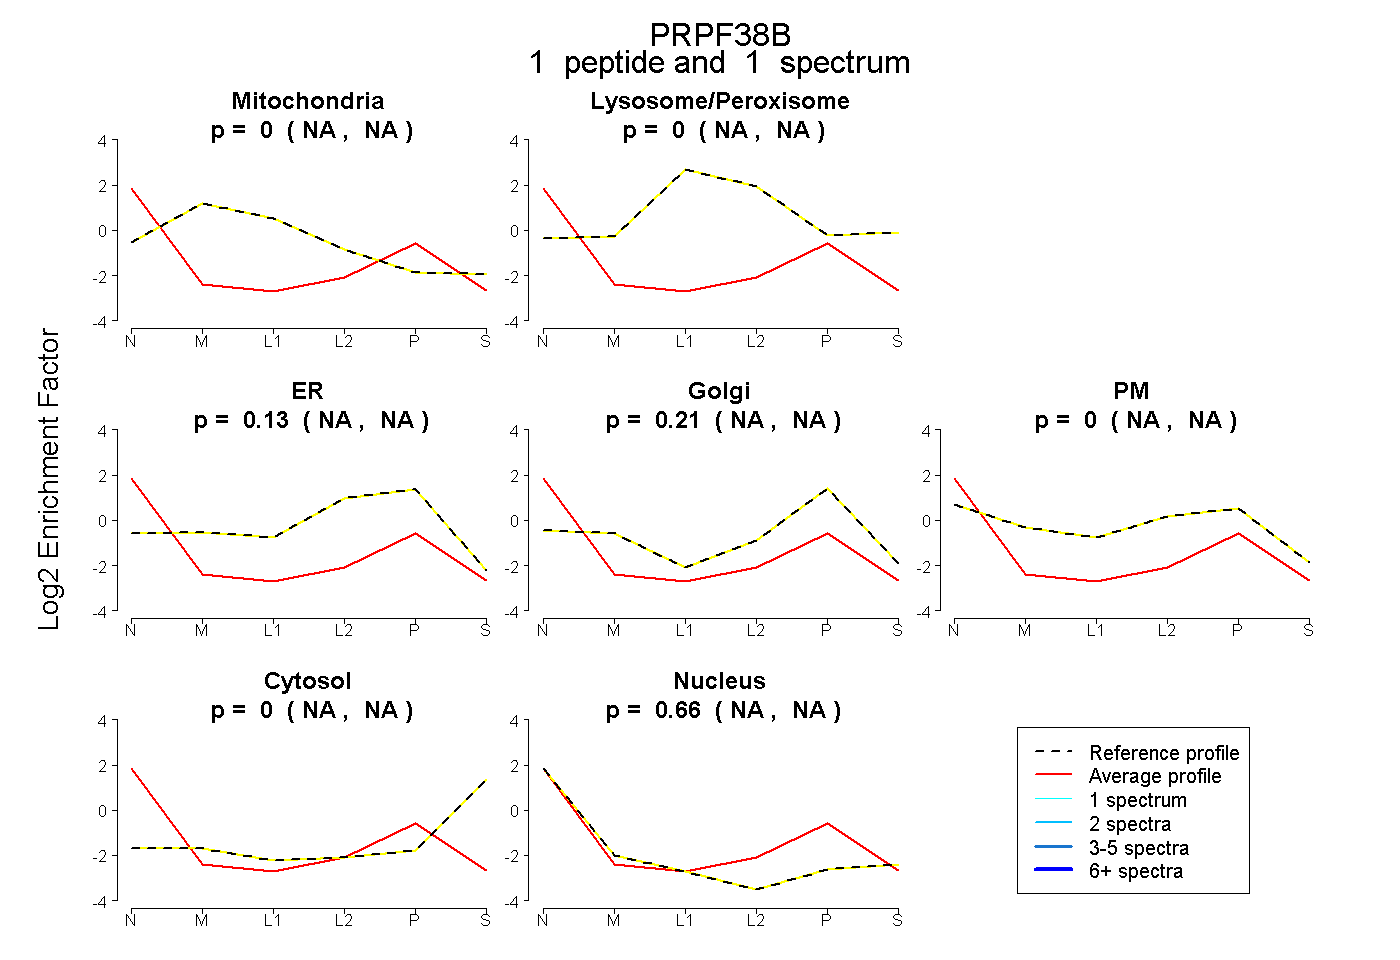
| Plot | Mito | Lyso or Perox | ER | Golgi | PM | Cytosol | Nucleus | ||||||
| Expt B |
1 peptide |
1 spectrum |
|
0.000 NA | NA |
0.000 NA | NA |
0.128 NA | NA |
0.209 NA | NA |
0.000 NA | NA |
0.000 NA | NA |
0.663 NA | NA |