 3
3peptides
spectra
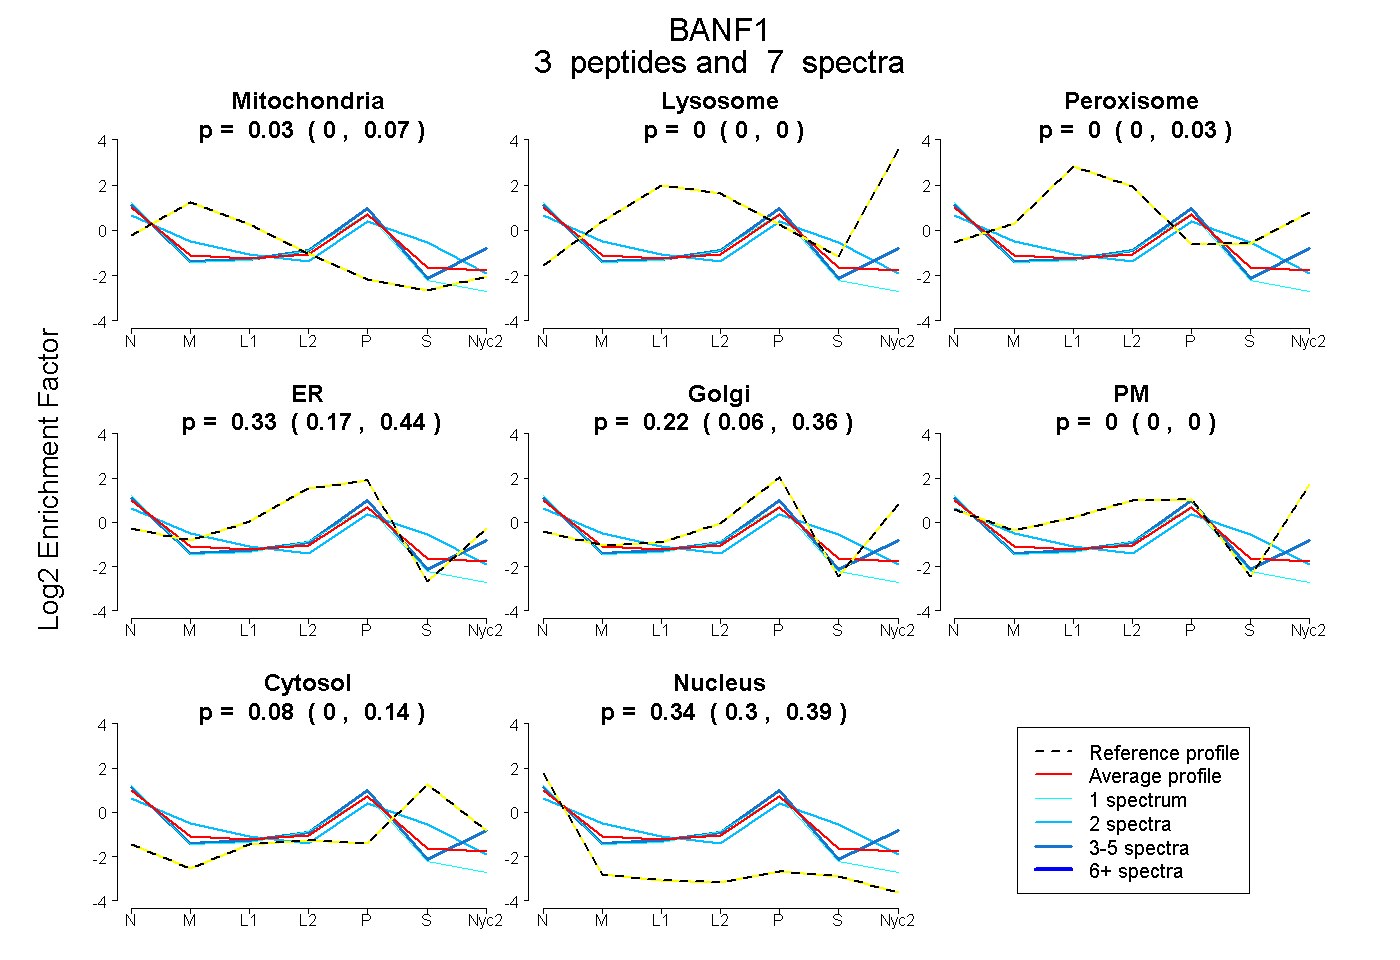
0.000 | 0.071
0.000 | 0.000
0.000 | 0.033
0.170 | 0.440
0.062 | 0.359
0.000 | 0.000
0.000 | 0.143
0.297 | 0.385
| Plot | Mito | Lyso | Perox | ER | Golgi | PM | Cytosol | Nucleus | |||||
| Expt A |
3 peptides |
7 spectra |
|
0.031 0.000 | 0.071 |
0.000 0.000 | 0.000 |
0.000 0.000 | 0.033 |
0.332 0.170 | 0.440 |
0.217 0.062 | 0.359 |
0.000 0.000 | 0.000 |
0.081 0.000 | 0.143 |
0.340 0.297 | 0.385 |
| 1 spectrum, DTCGANAK | 0.000 | 0.000 | 0.000 | 0.535 | 0.000 | 0.000 | 0.000 | 0.465 | ||
| 2 spectra, DCFGCLR | 0.205 | 0.000 | 0.000 | 0.131 | 0.208 | 0.000 | 0.275 | 0.181 | ||
| 4 spectra, DEDIFR | 0.000 | 0.000 | 0.000 | 0.108 | 0.477 | 0.103 | 0.000 | 0.312 |
| Plot | Lyso | Other | |||||||||||
| Expt C |
2 peptides |
3 spectra |
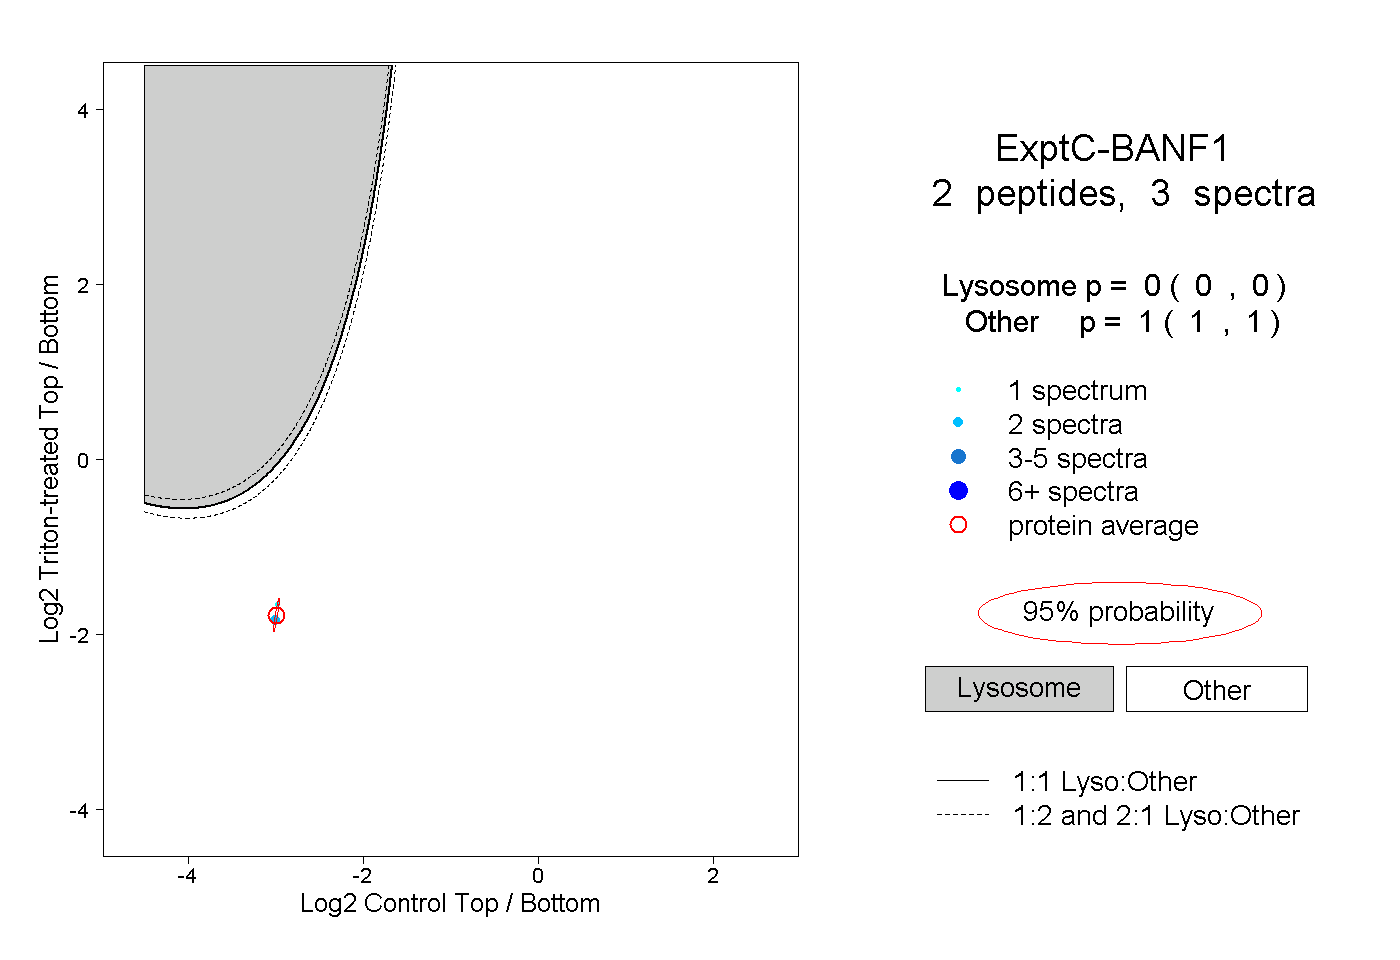 |
0.000 0.000 | 0.000 |
1.000 1.000 | 1.000 |