 2
2peptides
spectra
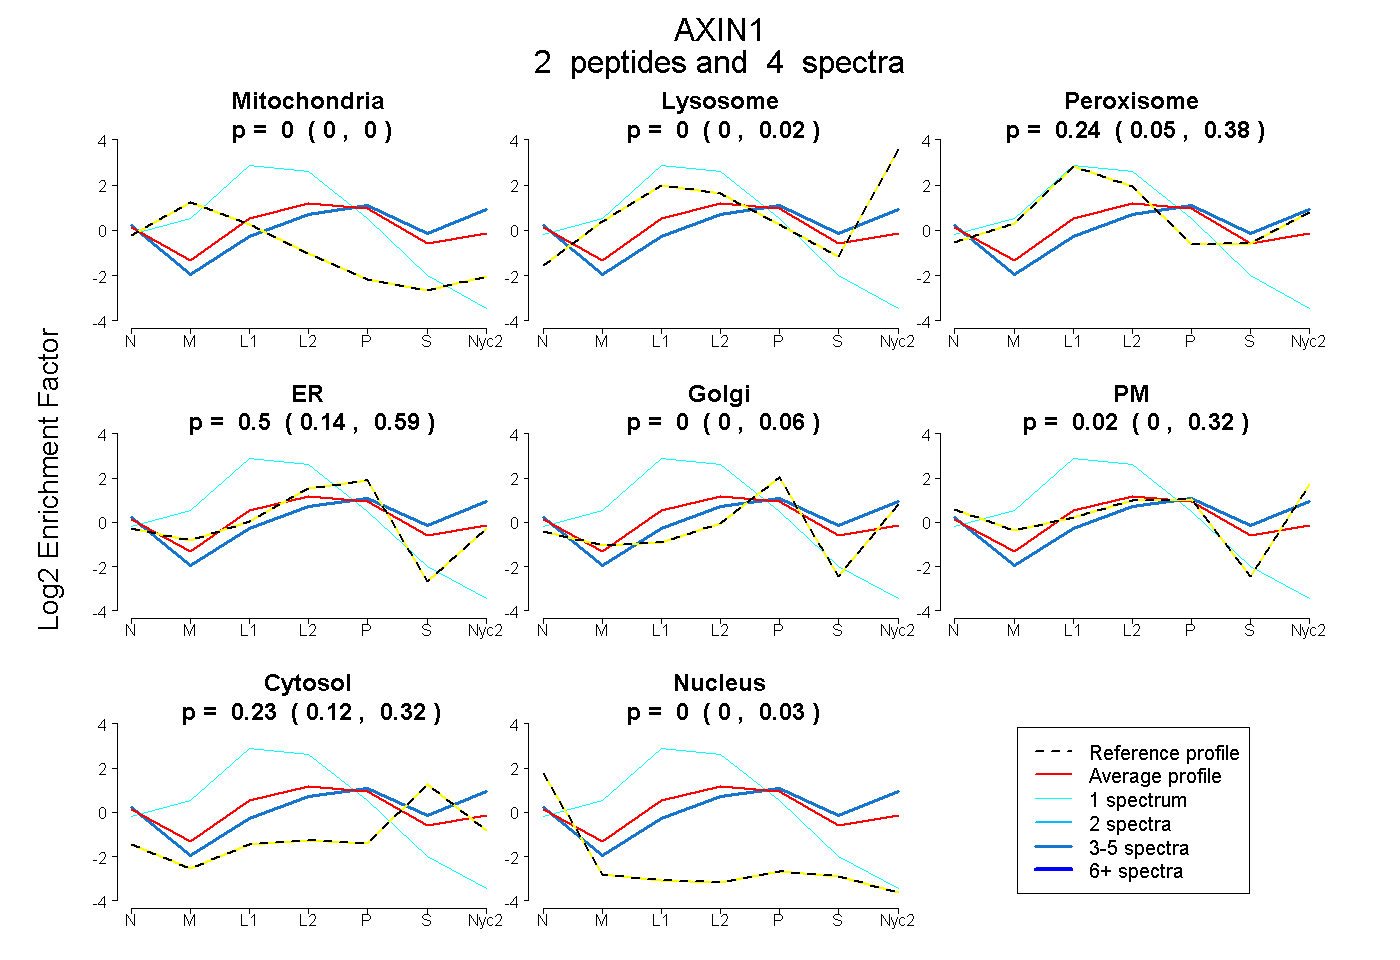
0.000 | 0.000
0.000 | 0.016
0.047 | 0.378
0.139 | 0.591
0.000 | 0.060
0.000 | 0.318
0.120 | 0.321
0.000 | 0.030
| Plot | Mito | Lyso | Perox | ER | Golgi | PM | Cytosol | Nucleus | |||||
| Expt A |
2 peptides |
4 spectra |
|
0.000 0.000 | 0.000 |
0.000 0.000 | 0.016 |
0.244 0.047 | 0.378 |
0.503 0.139 | 0.591 |
0.000 0.000 | 0.060 |
0.018 0.000 | 0.318 |
0.235 0.120 | 0.321 |
0.000 0.000 | 0.030 |
| 3 spectra, VPLPHIPR | 0.000 | 0.027 | 0.000 | 0.116 | 0.000 | 0.495 | 0.362 | 0.000 | ||
| 1 spectrum, LLLETAAPR | 0.247 | 0.000 | 0.415 | 0.338 | 0.000 | 0.000 | 0.000 | 0.000 |
| Plot | Lyso | Other | |||||||||||
| Expt D |
1 peptide |
1 spectrum |
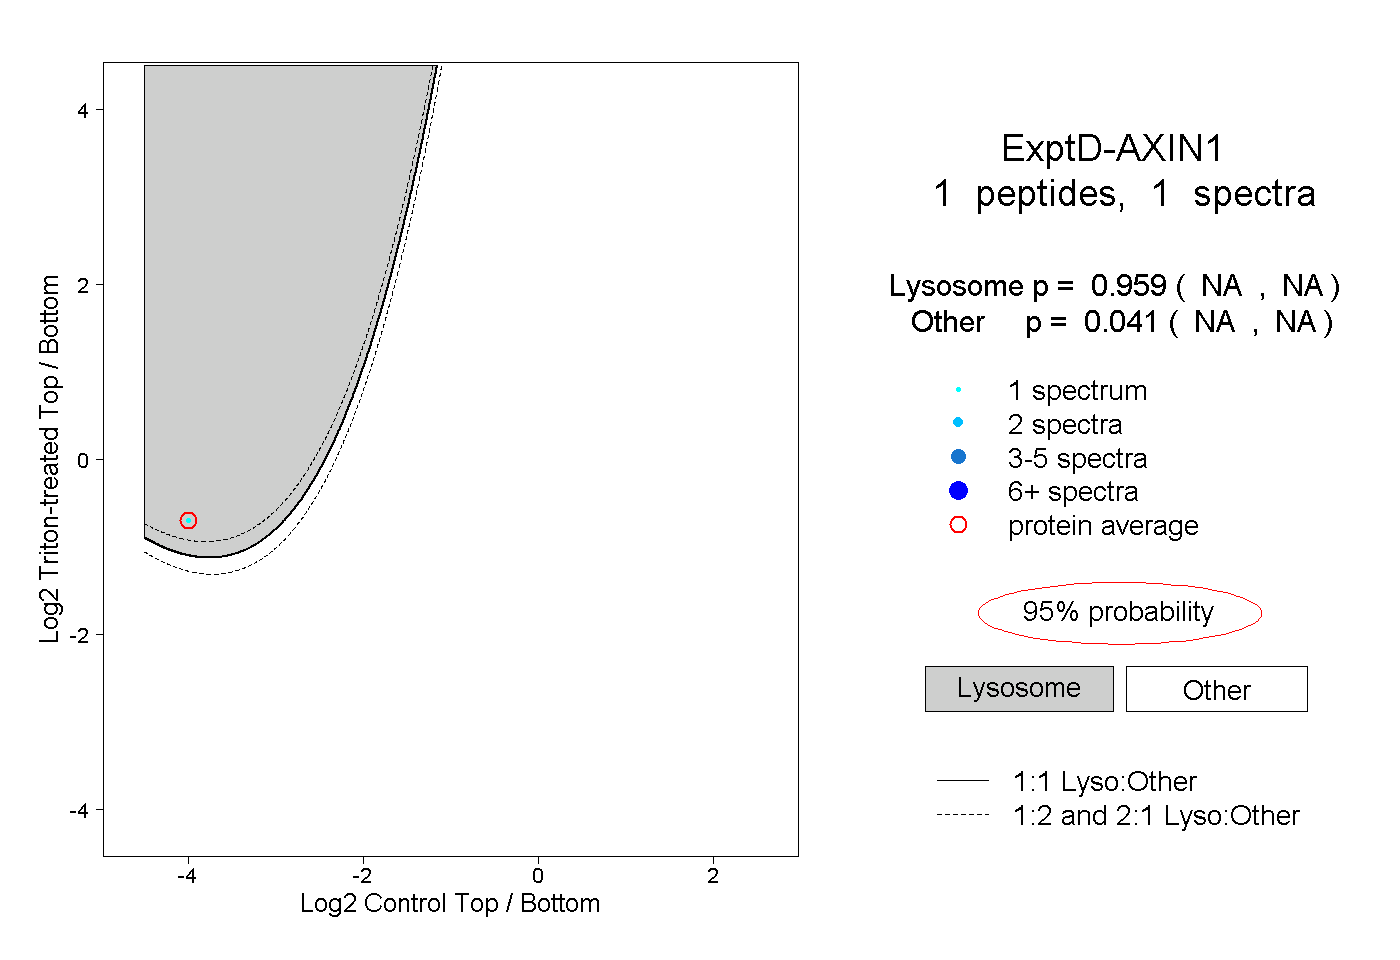 |
0.959 NA | NA |
0.041 NA | NA |