10
10peptides
spectra
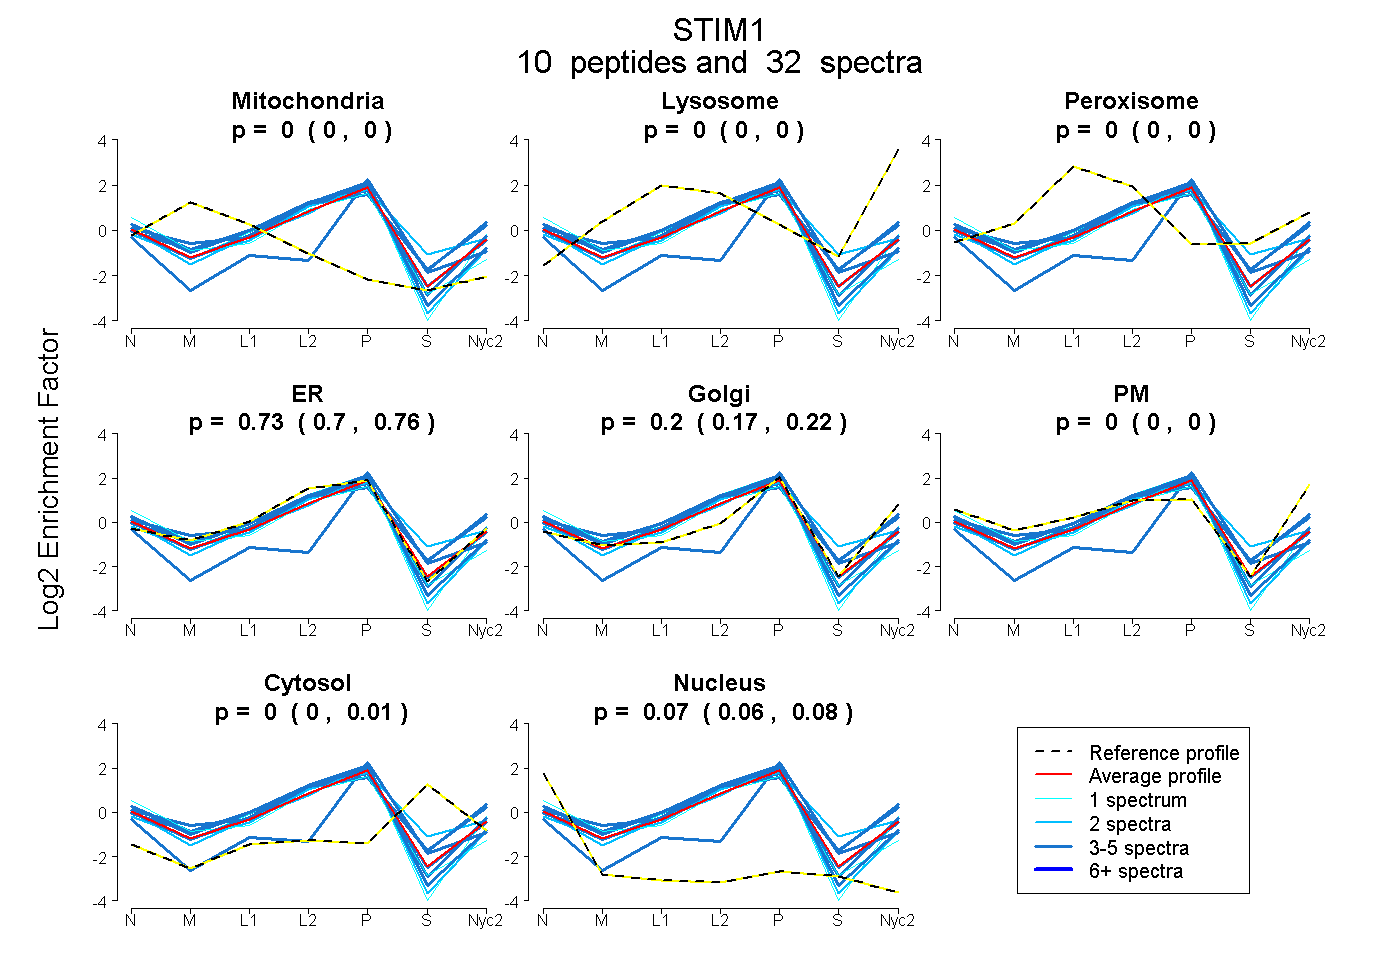
0.000 | 0.000
0.000 | 0.000
0.000 | 0.000
0.697 | 0.757
0.167 | 0.225
0.000 | 0.000
0.000 | 0.010
0.061 | 0.075
5peptides
spectra
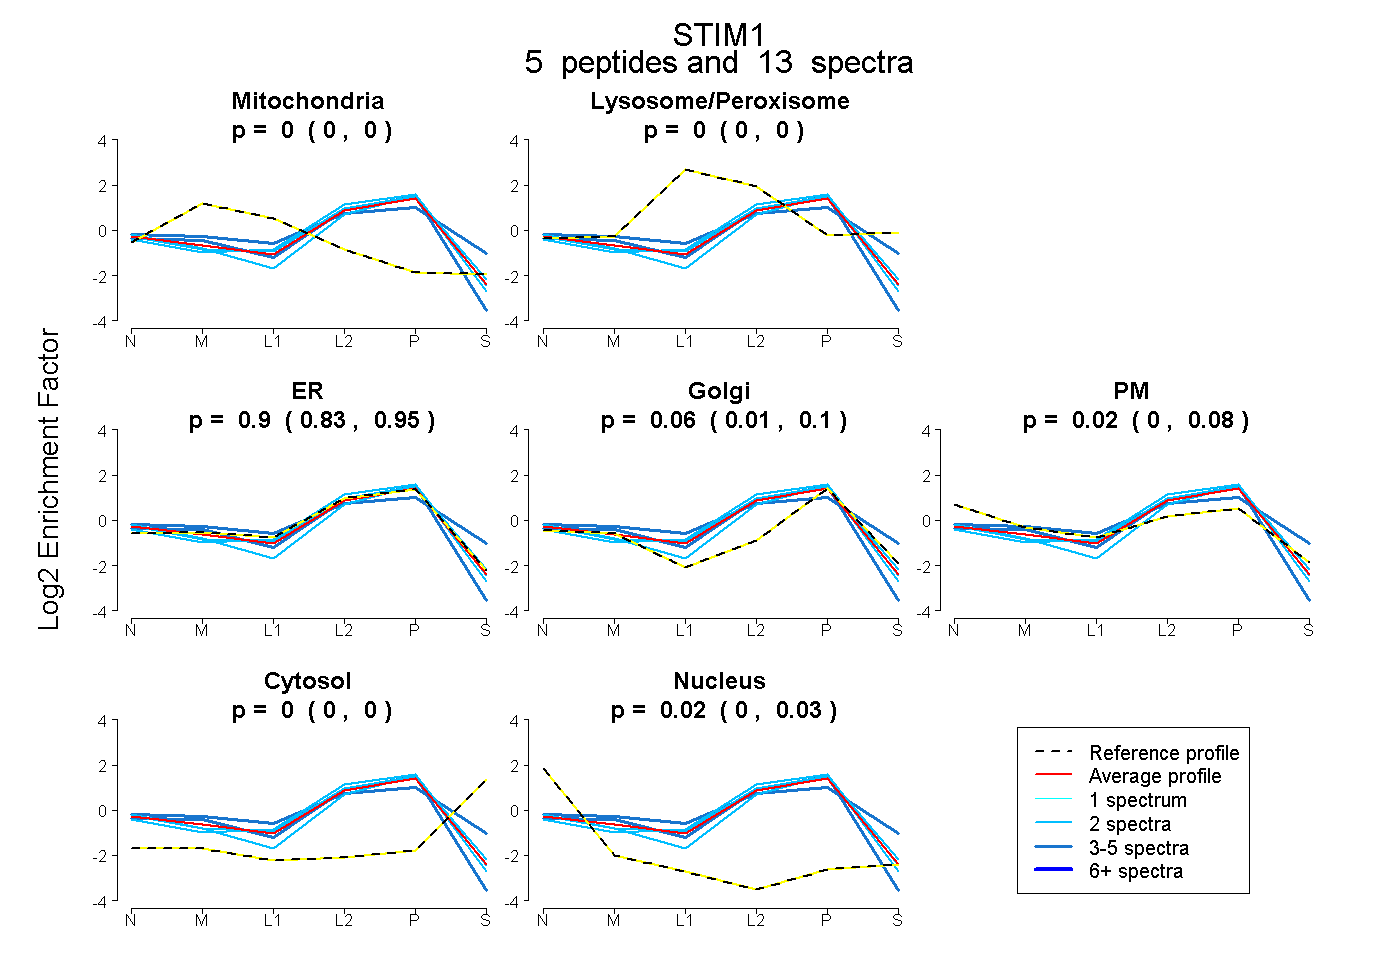
0.000 | 0.000
0.000 | 0.000
0.826 | 0.950
0.010 | 0.100
0.000 | 0.084
0.000 | 0.000
0.000 | 0.032
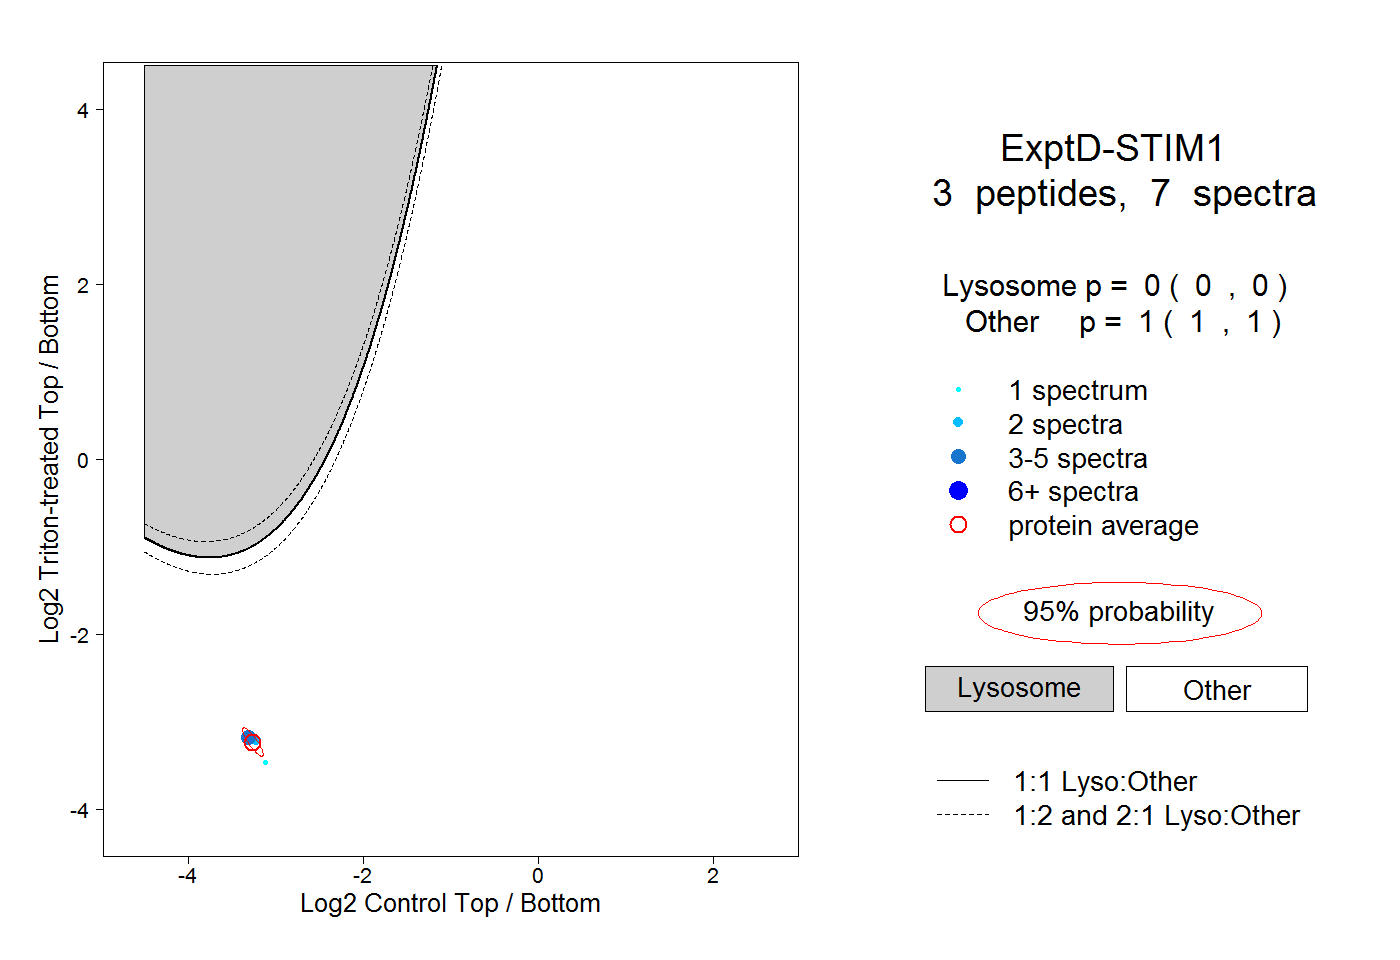
10peptides
spectra
0.000 | 0.000
1.000 | 1.000