STXBP3
[ENSRNOP00000027666]
Main page
| | | Plot |
Mito |
Lyso |
|
Perox |
ER |
Golgi |
PM |
Cytosol |
Nucleus |
|
| Expt A |
 17
17
peptides |
47
spectra |
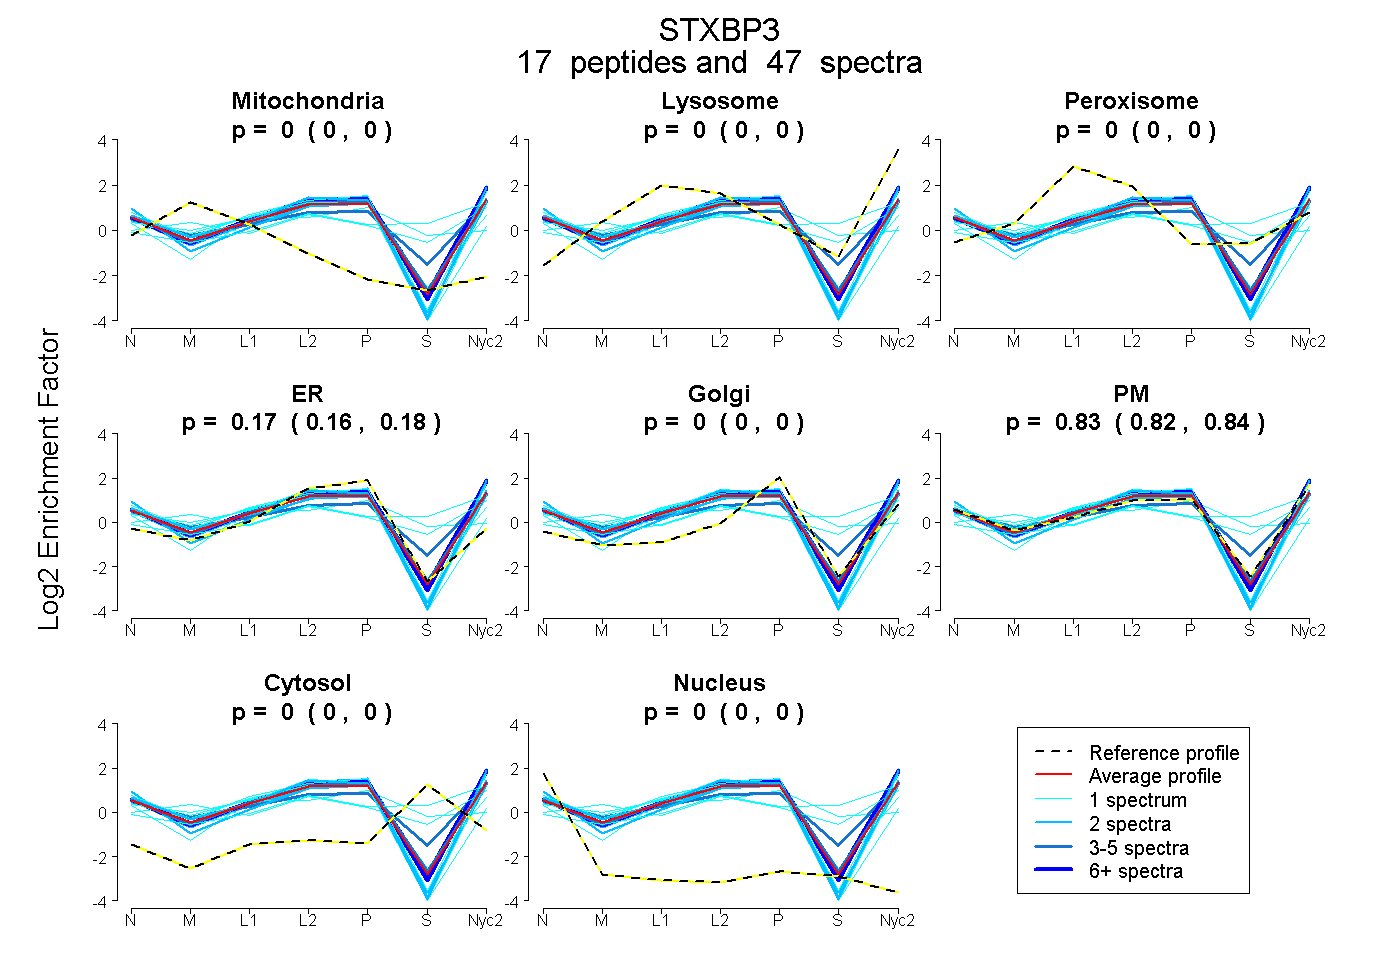 |
0.000
0.000 | 0.000 |
0.000
0.000 | 0.000 |
|
0.000
0.000 | 0.000 |
0.171
0.157 | 0.183 |
0.000
0.000 | 0.000 |
0.829
0.815 | 0.840 |
0.000
0.000 | 0.000 |
0.000
0.000 | 0.000 |
|
| | | Plot |
Mito |
|
Lyso or Perox |
|
ER |
Golgi |
PM |
Cytosol |
Nucleus |
|
| Expt B |
4
peptides |
10
spectra |
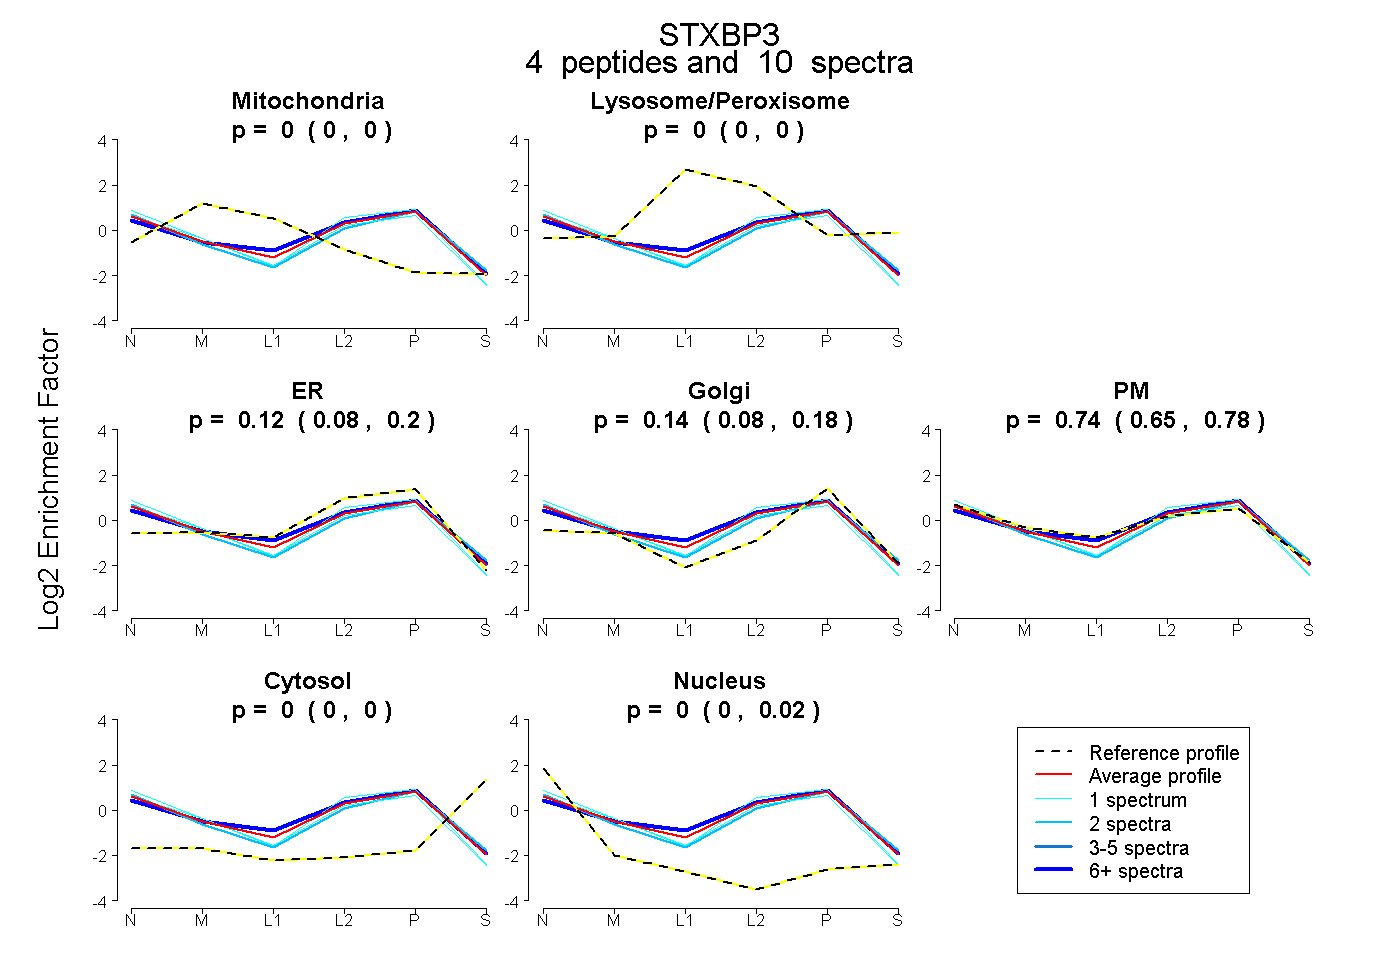 |
0.000
0.000 | 0.000 |
|
0.000
0.000 | 0.000 |
|
0.122
0.076 | 0.201 |
0.140
0.076 | 0.183 |
0.738
0.648 | 0.777 |
0.000
0.000 | 0.000 |
0.000
0.000 | 0.020 |
|
| 1 spectrum, IMLLDDFTTR |
0.000 |
|
0.000 |
|
0.270 |
0.142 |
0.571 |
0.000 |
0.017 |
|
| 1 spectrum, TQSQLLIIDR |
0.000 |
|
0.000 |
|
0.084 |
0.124 |
0.741 |
0.000 |
0.051 |
|
| 2 spectra, SAEETFQLSR |
0.000 |
|
0.000 |
|
0.000 |
0.304 |
0.678 |
0.000 |
0.018 |
|
| 6 spectra, IEDDSDMIR |
0.000 |
|
0.000 |
|
0.238 |
0.058 |
0.704 |
0.000 |
0.000 |
|
| | | Plot |
|
Lyso |
|
|
|
|
|
|
|
Other |
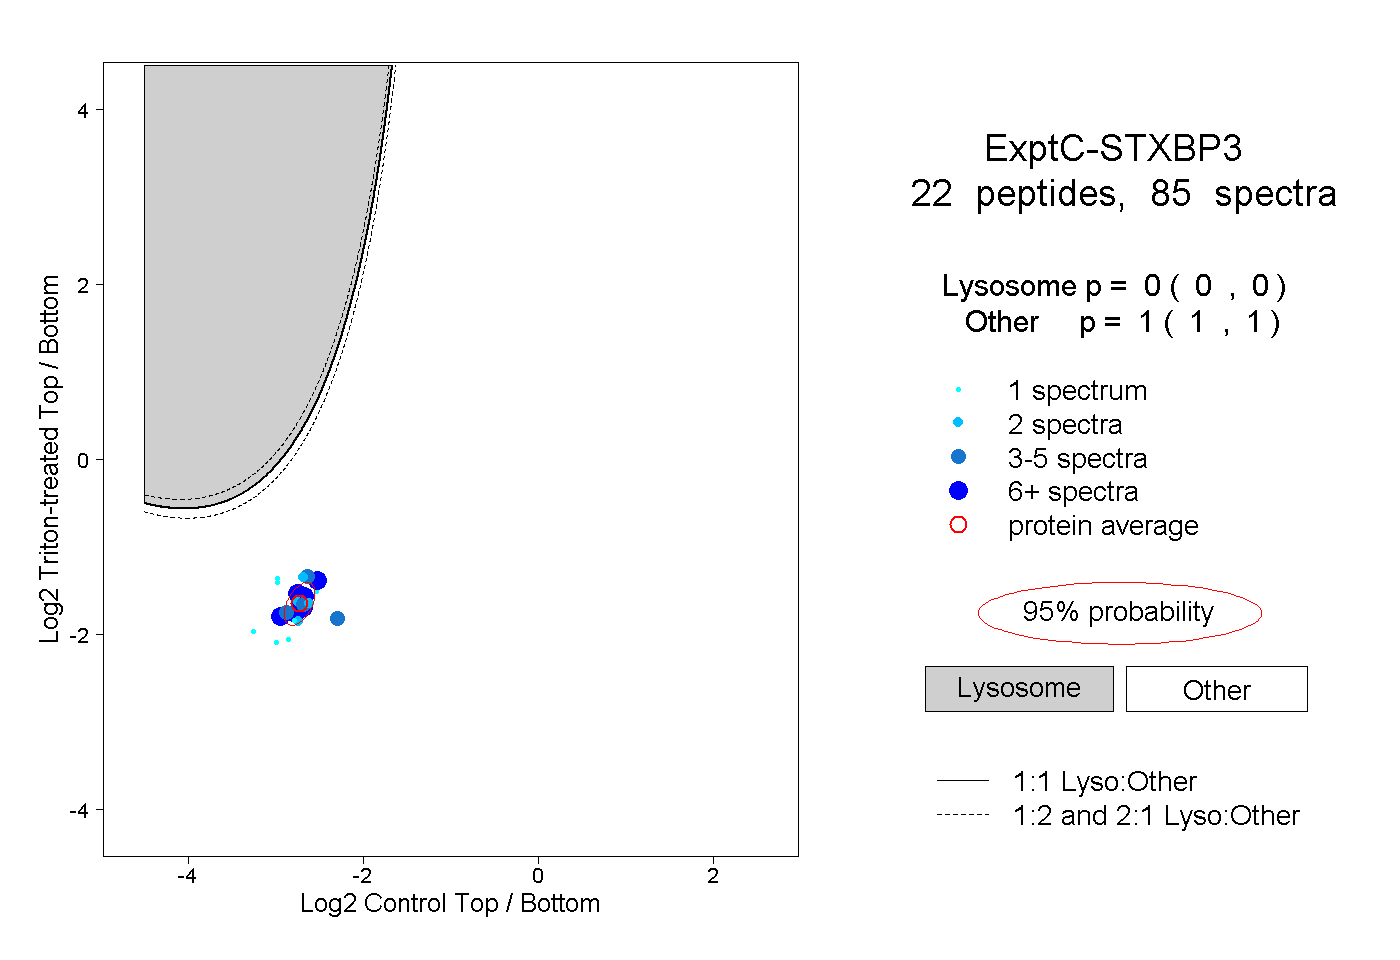
| Expt C |
22
peptides |
85
spectra |
 |
|
0.000
0.000 | 0.000 |
|
|
|
|
|
|
|
1.000
1.000 | 1.000 |
| | | Plot |
|
Lyso |
|
|
|
|
|
|
|
Other |
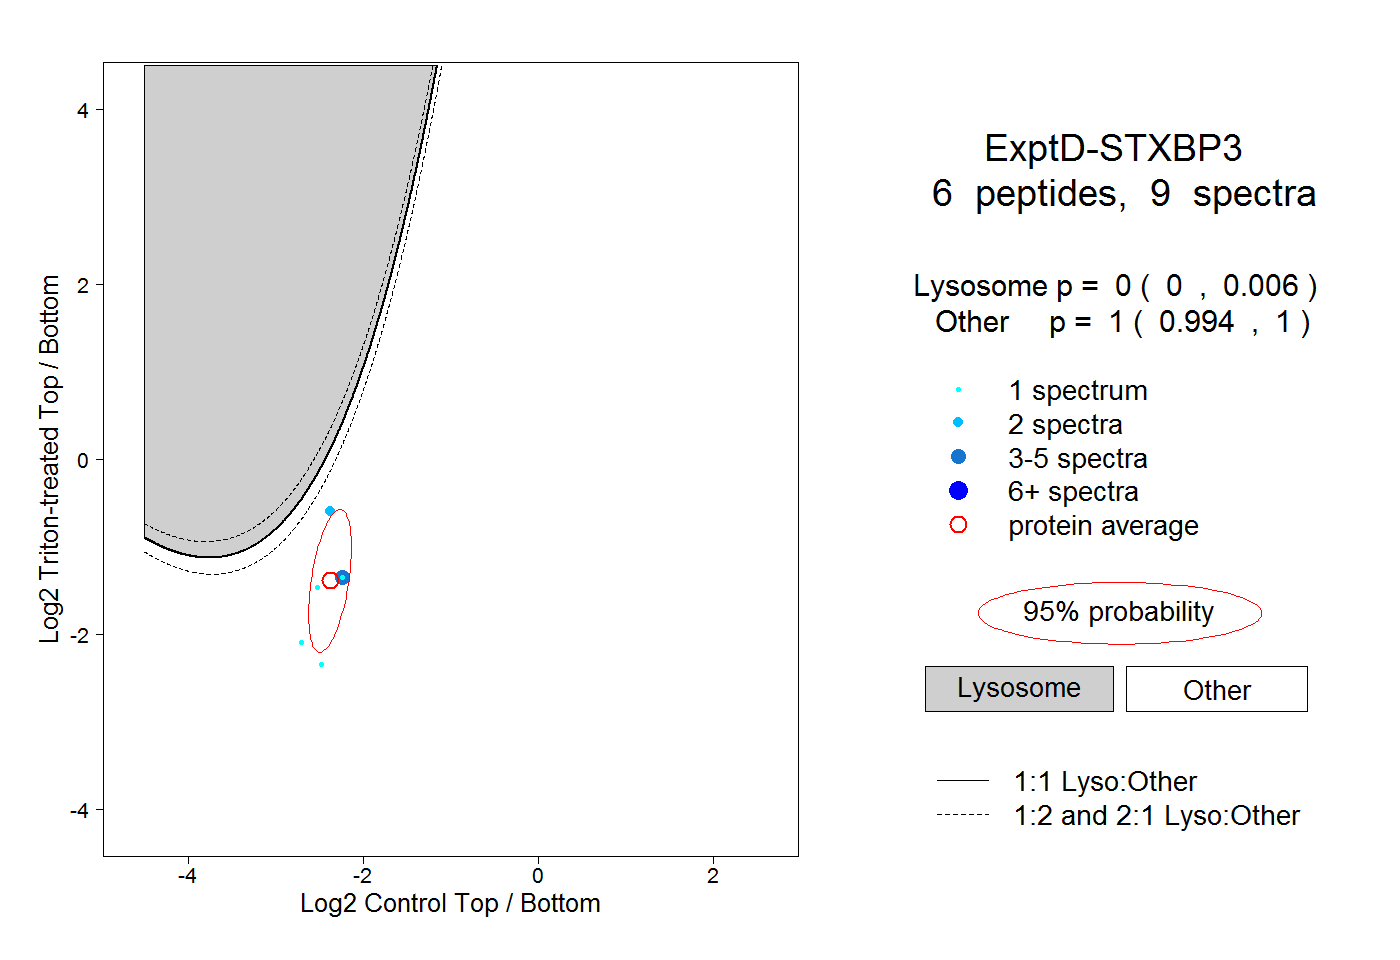
| Expt D |
6
peptides |
9
spectra |
 |
|
0.000
0.000 | 0.006 |
|
|
|
|
|
|
|
1.000
0.994 | 1.000 |