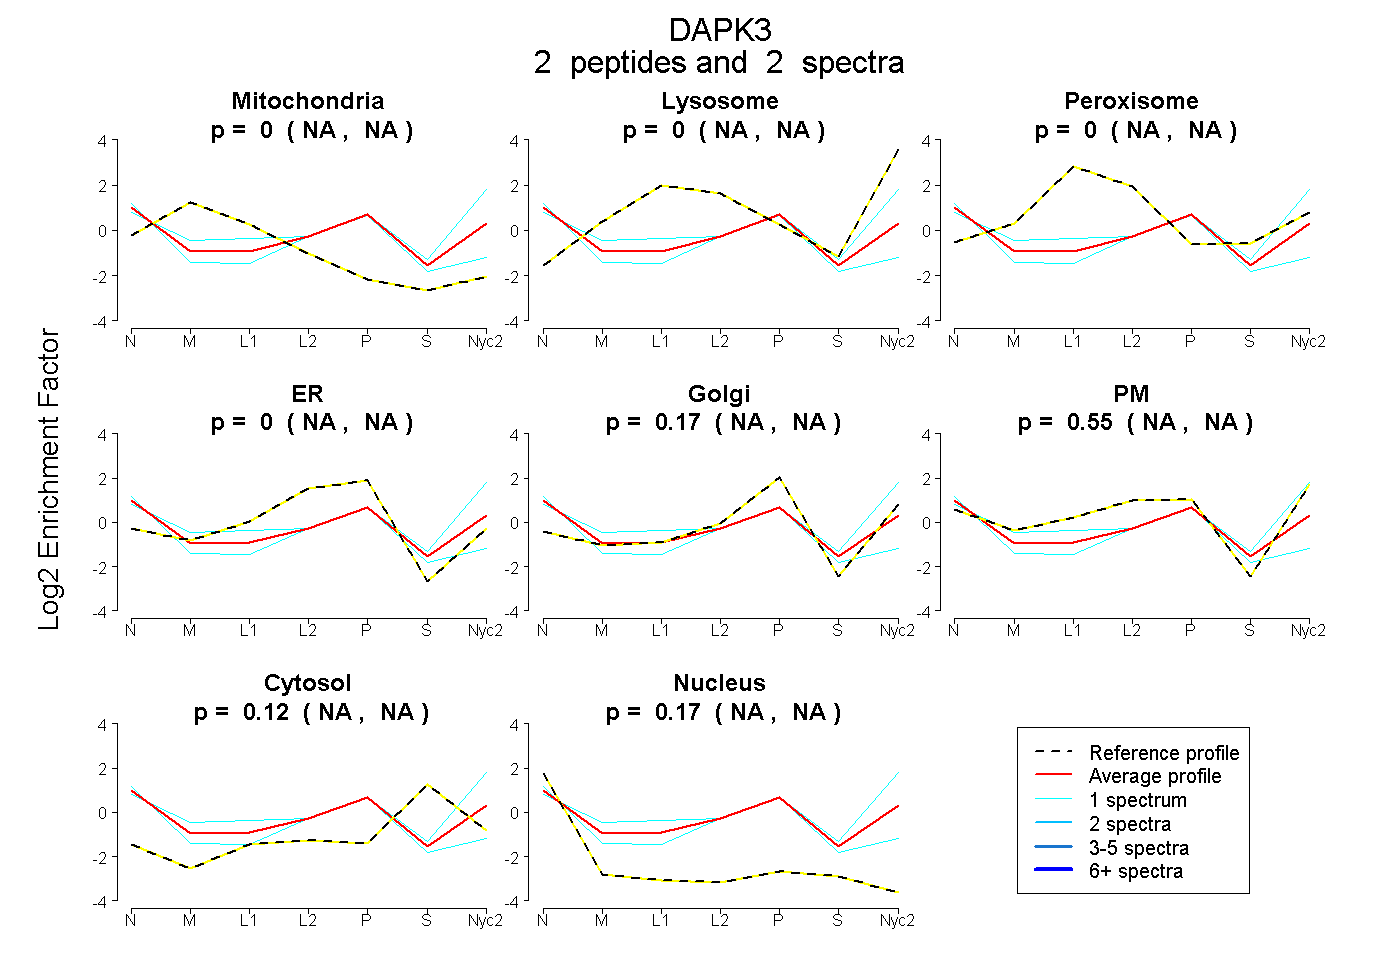
 2
2peptides
spectra
NA | NA
NA | NA
NA | NA
NA | NA
NA | NA
NA | NA
NA | NA
NA | NA
| Plot | Mito | Lyso | Perox | ER | Golgi | PM | Cytosol | Nucleus | |||||
| Expt A |
2 peptides |
2 spectra |
|
0.000 NA | NA |
0.000 NA | NA |
0.000 NA | NA |
0.000 NA | NA |
0.167 NA | NA |
0.546 NA | NA |
0.121 NA | NA |
0.165 NA | NA |
| 1 spectrum, VLEDVAAAEQGLR | 0.000 | 0.000 | 0.000 | 0.378 | 0.132 | 0.114 | 0.058 | 0.319 | ||
| 1 spectrum, IEAGSEFK | 0.000 | 0.000 | 0.000 | 0.000 | 0.000 | 0.802 | 0.193 | 0.005 |
| Plot | Lyso | Other | |||||||||||
| Expt C |
1 peptide |
1 spectrum |
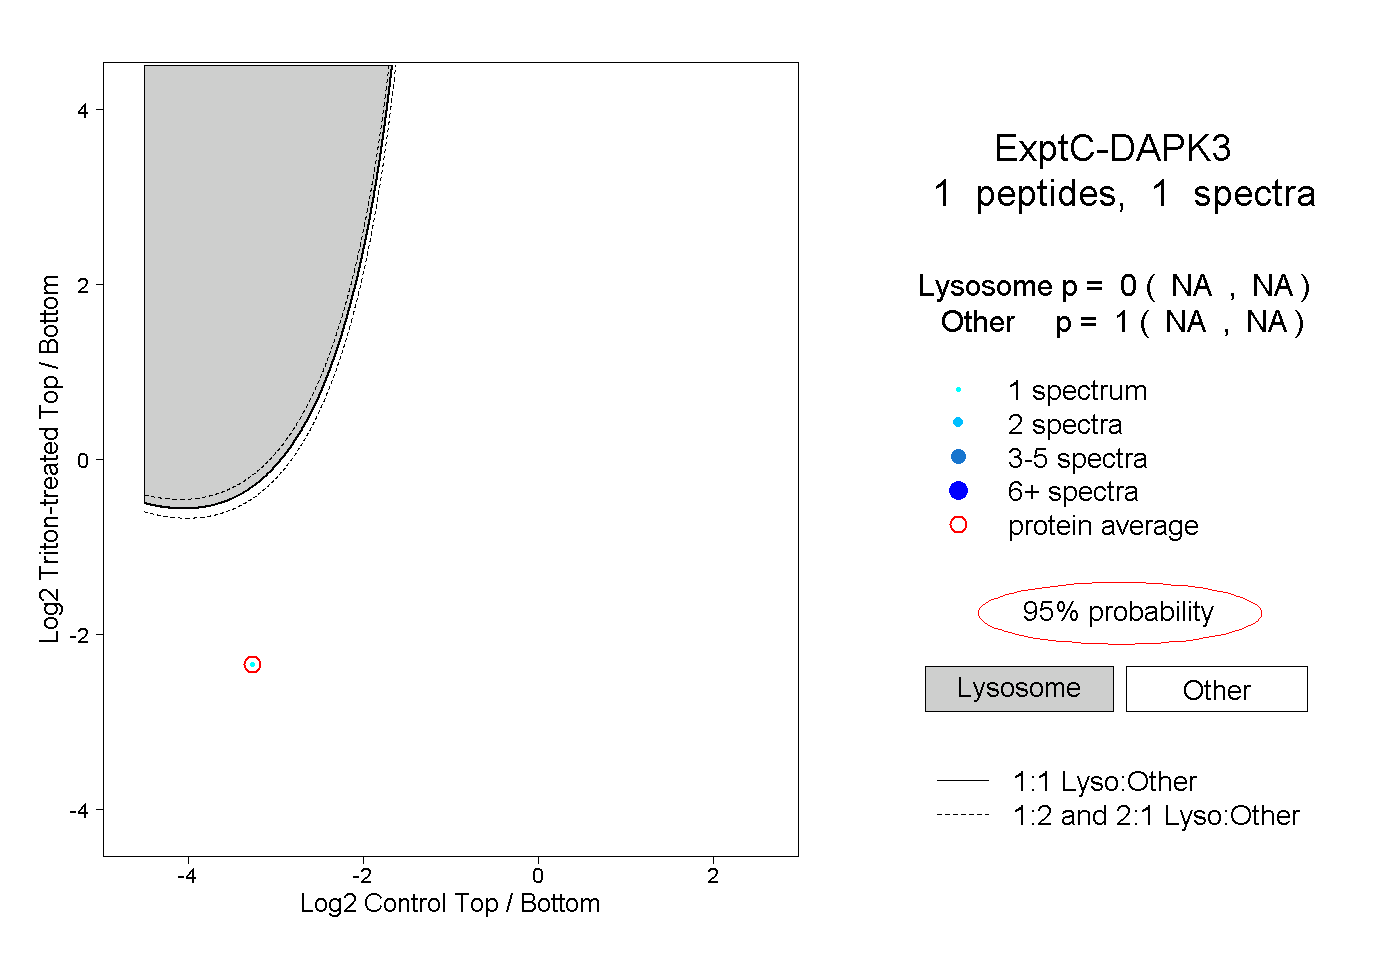 |
0.000 NA | NA |
1.000 NA | NA |