 5
5peptides
spectra
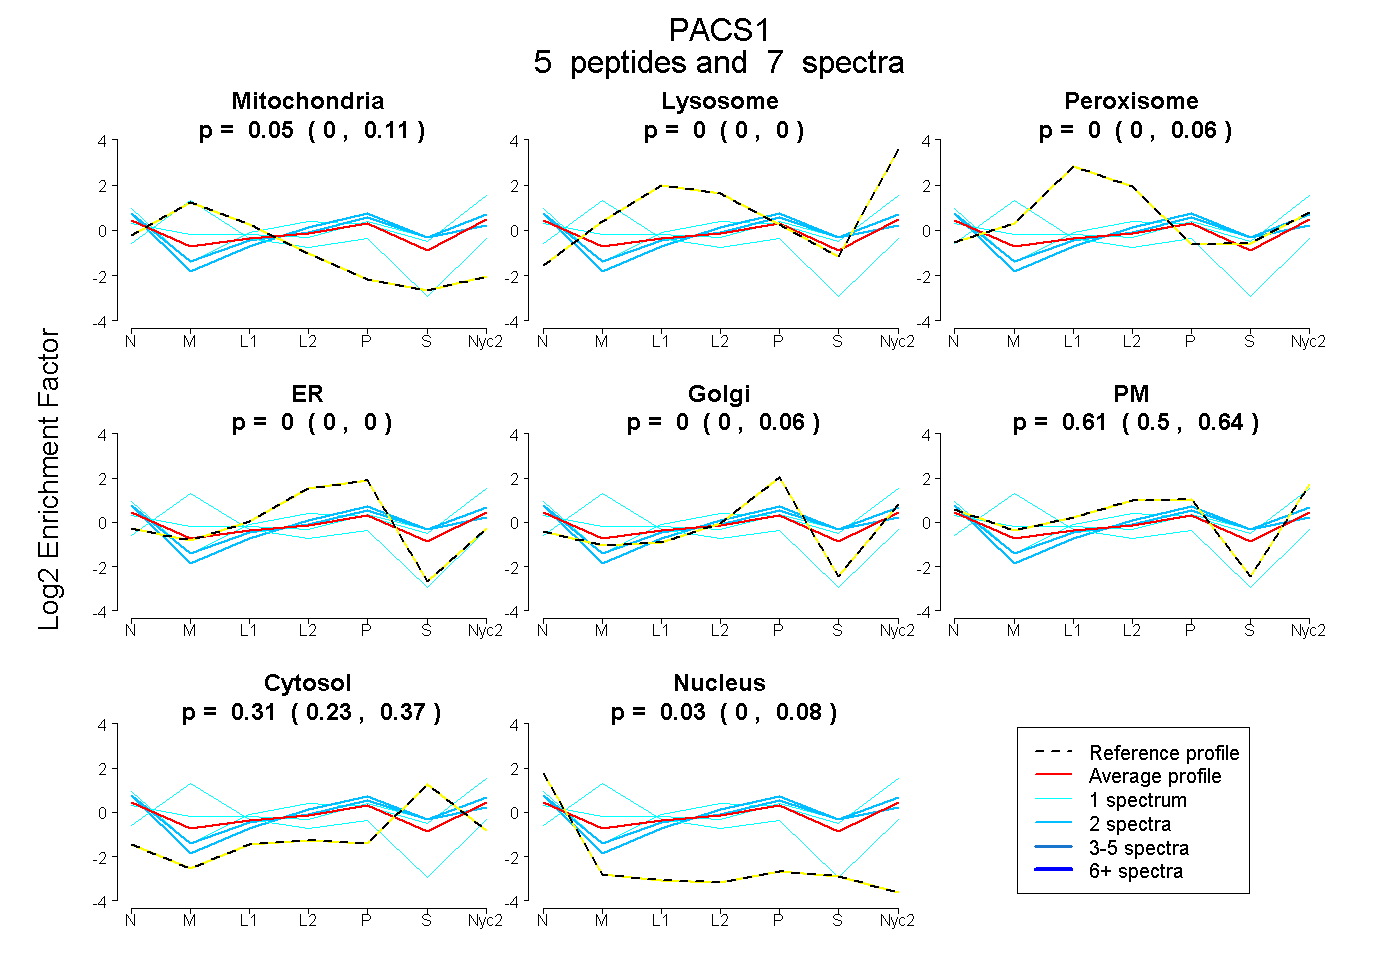
0.000 | 0.111
0.000 | 0.000
0.000 | 0.056
0.000 | 0.000
0.000 | 0.063
0.501 | 0.642
0.231 | 0.366
0.000 | 0.082
1peptide
spectrum
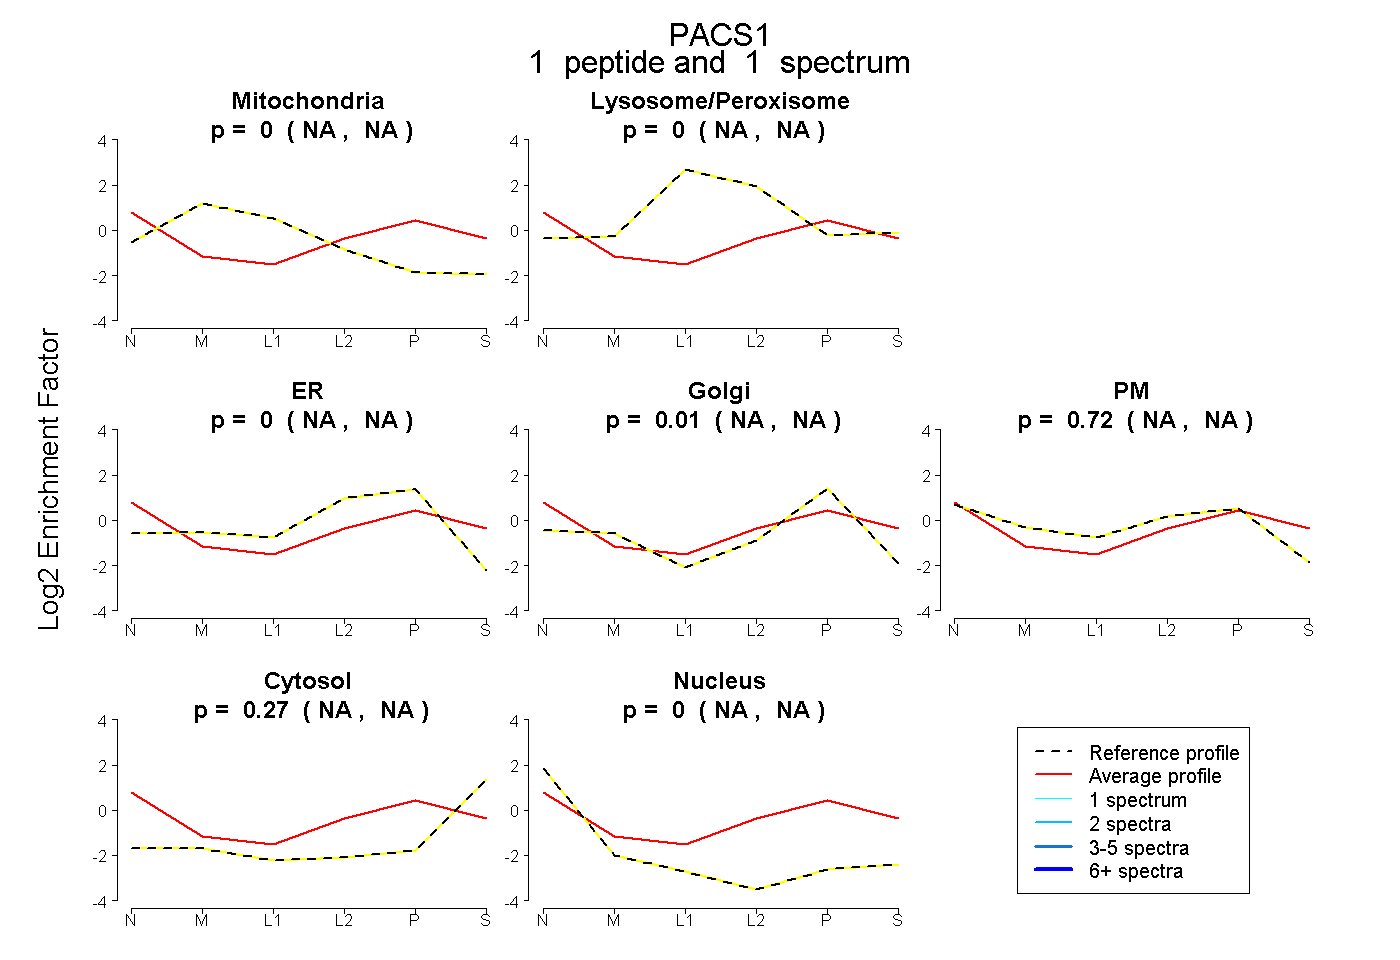
NA | NA
NA | NA
NA | NA
NA | NA
NA | NA
NA | NA
NA | NA
2peptides
spectra
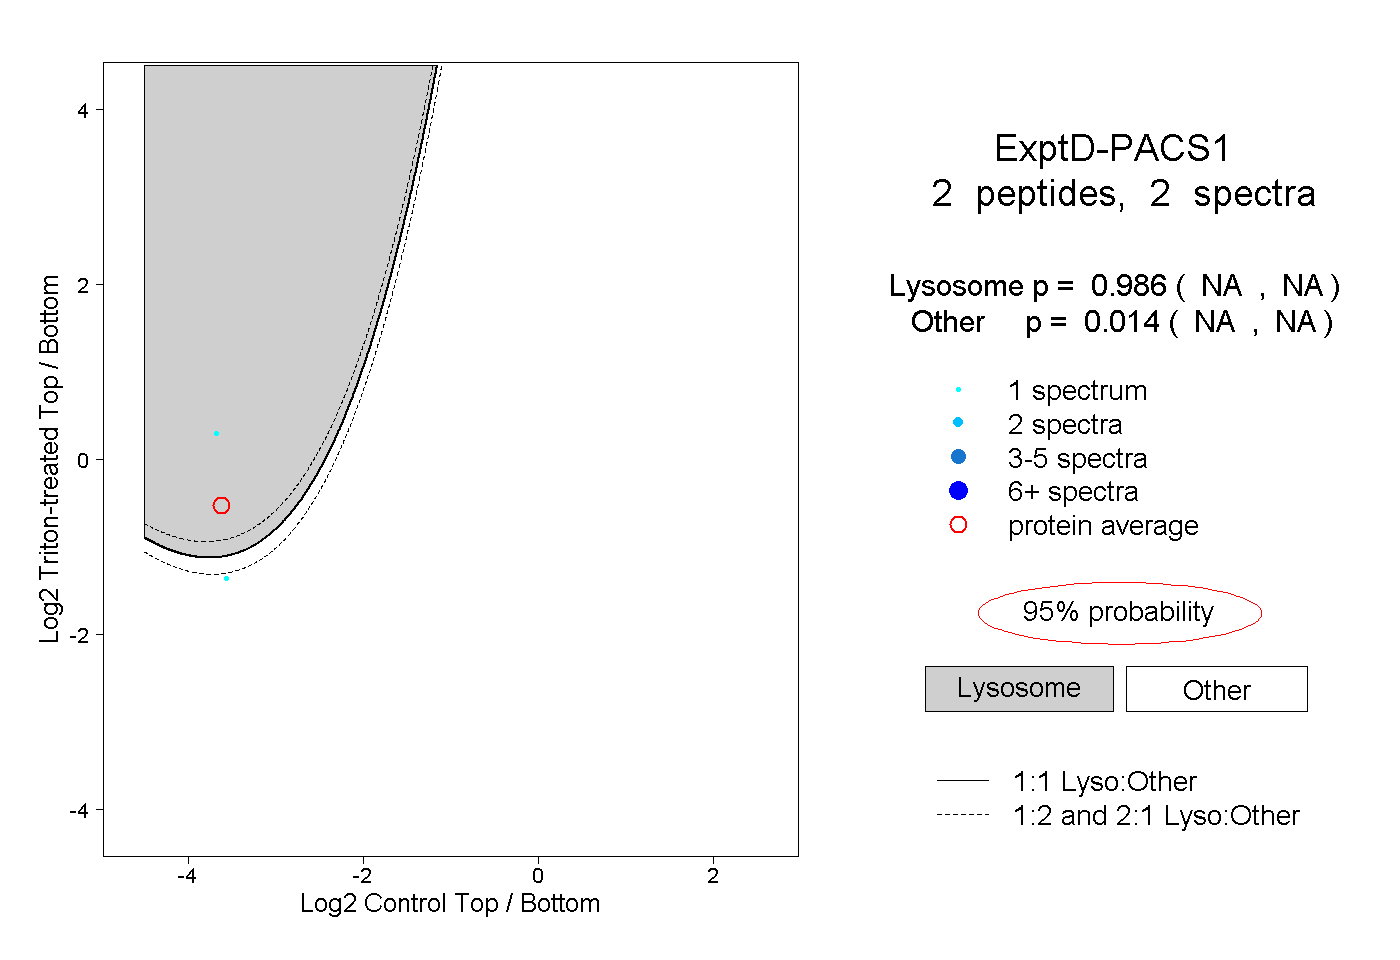
NA | NA
NA | NA