 10
10peptides
spectra
0.000 | 0.000
0.000 | 0.000
0.000 | 0.000
0.000 | 0.000
0.000 | 0.000
0.278 | 0.299
0.604 | 0.622
0.089 | 0.104
| Plot | Mito | Lyso | Perox | ER | Golgi | PM | Cytosol | Nucleus | |||||
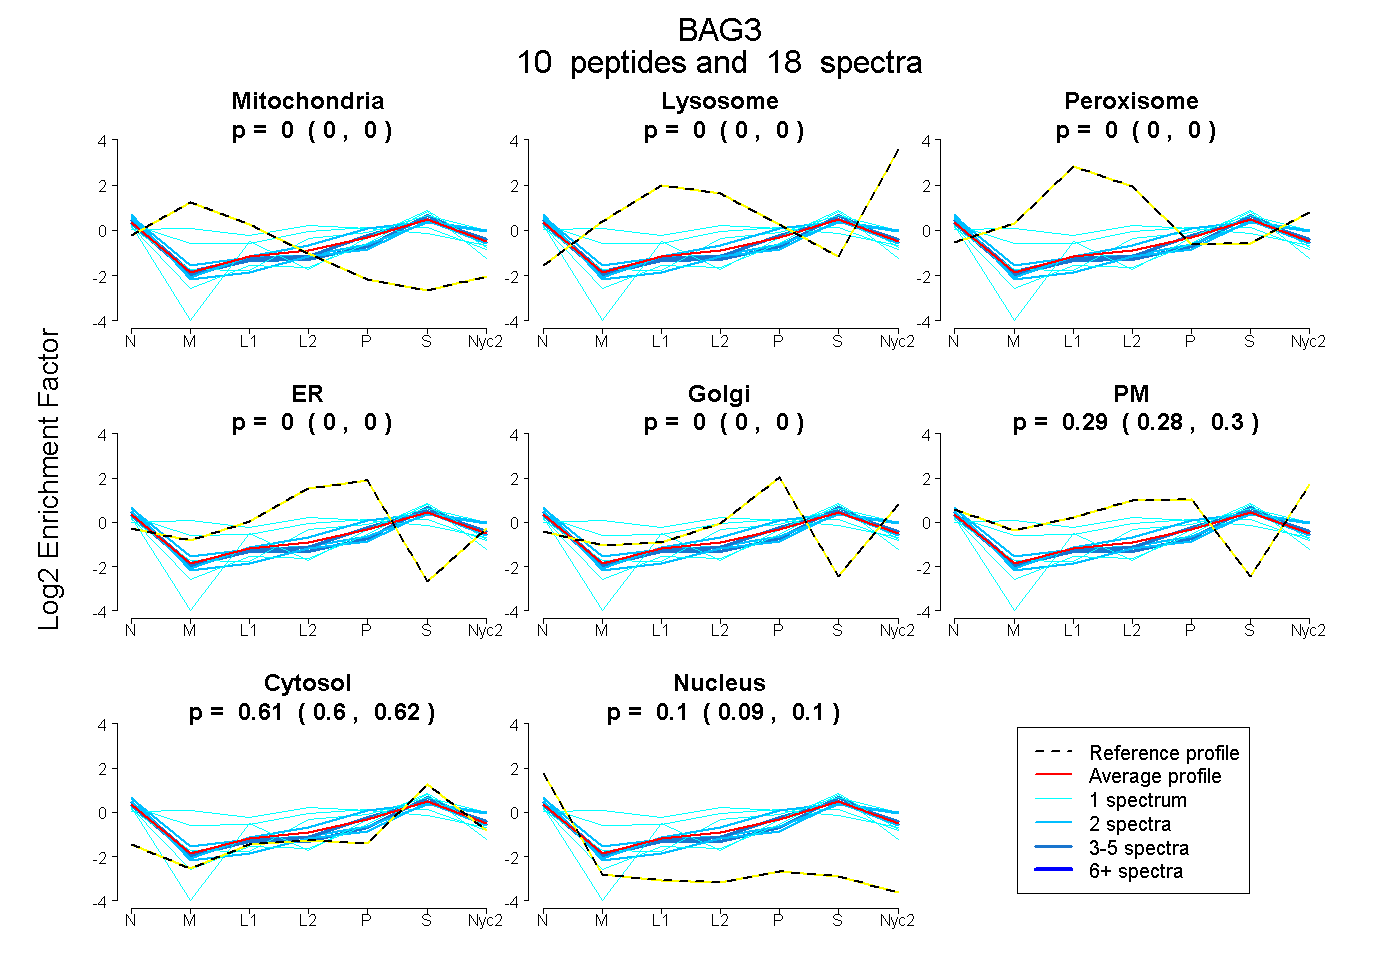
| Expt A |
10 peptides |
18 spectra |
|
0.000 0.000 | 0.000 |
0.000 0.000 | 0.000 |
0.000 0.000 | 0.000 |
0.000 0.000 | 0.000 |
0.000 0.000 | 0.000 |
0.289 0.278 | 0.299 |
0.614 0.604 | 0.622 |
0.097 0.089 | 0.104 |
| 3 spectra, IQGDDWEPRPLR | 0.000 | 0.000 | 0.000 | 0.000 | 0.016 | 0.275 | 0.604 | 0.106 | ||
| 2 spectra, ETASSANGPSR | 0.000 | 0.000 | 0.000 | 0.000 | 0.000 | 0.321 | 0.567 | 0.112 | ||
| 1 spectrum, SSLGSHQLPR | 0.180 | 0.000 | 0.181 | 0.220 | 0.000 | 0.096 | 0.324 | 0.000 | ||
| 2 spectra, TEAAAAAPQR | 0.000 | 0.000 | 0.000 | 0.000 | 0.031 | 0.334 | 0.581 | 0.054 | ||
| 2 spectra, VEAILEK | 0.000 | 0.000 | 0.000 | 0.000 | 0.000 | 0.203 | 0.605 | 0.192 | ||
| 1 spectrum, QPHLFHAYSQPGVQR | 0.000 | 0.000 | 0.000 | 0.000 | 0.069 | 0.267 | 0.651 | 0.013 | ||
| 1 spectrum, THYPAQQGEYQPQQPVYHK | 0.000 | 0.000 | 0.000 | 0.000 | 0.082 | 0.039 | 0.778 | 0.102 | ||
| 4 spectra, ELLALDSVDPEGR | 0.000 | 0.000 | 0.000 | 0.000 | 0.000 | 0.210 | 0.670 | 0.119 | ||
| 1 spectrum, YLMIEEYLTK | 0.000 | 0.000 | 0.000 | 0.000 | 0.117 | 0.000 | 0.718 | 0.165 | ||
| 1 spectrum, AAPSPAPAEAASLK | 0.084 | 0.000 | 0.113 | 0.228 | 0.000 | 0.112 | 0.429 | 0.033 |
| Plot | Mito | Lyso or Perox | ER | Golgi | PM | Cytosol | Nucleus | ||||||
| Expt B |
1 peptide |
1 spectrum |
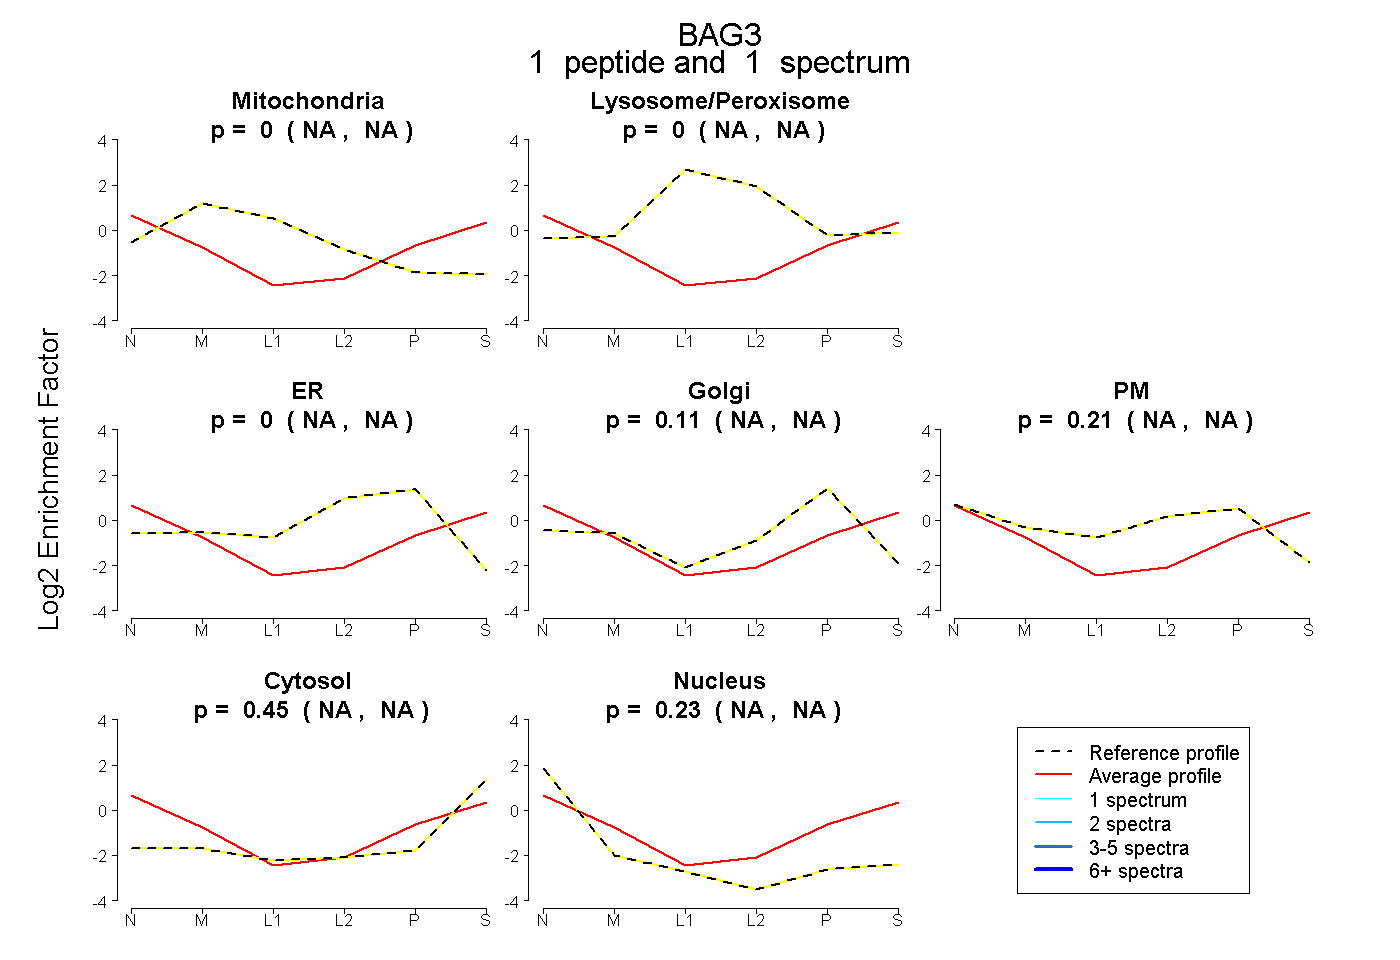 |
0.000 NA | NA |
0.000 NA | NA |
0.000 NA | NA |
0.114 NA | NA |
0.205 NA | NA |
0.451 NA | NA |
0.230 NA | NA |
|||
| Plot | Lyso | Other | |||||||||||
| Expt C |
6 peptides |
14 spectra |
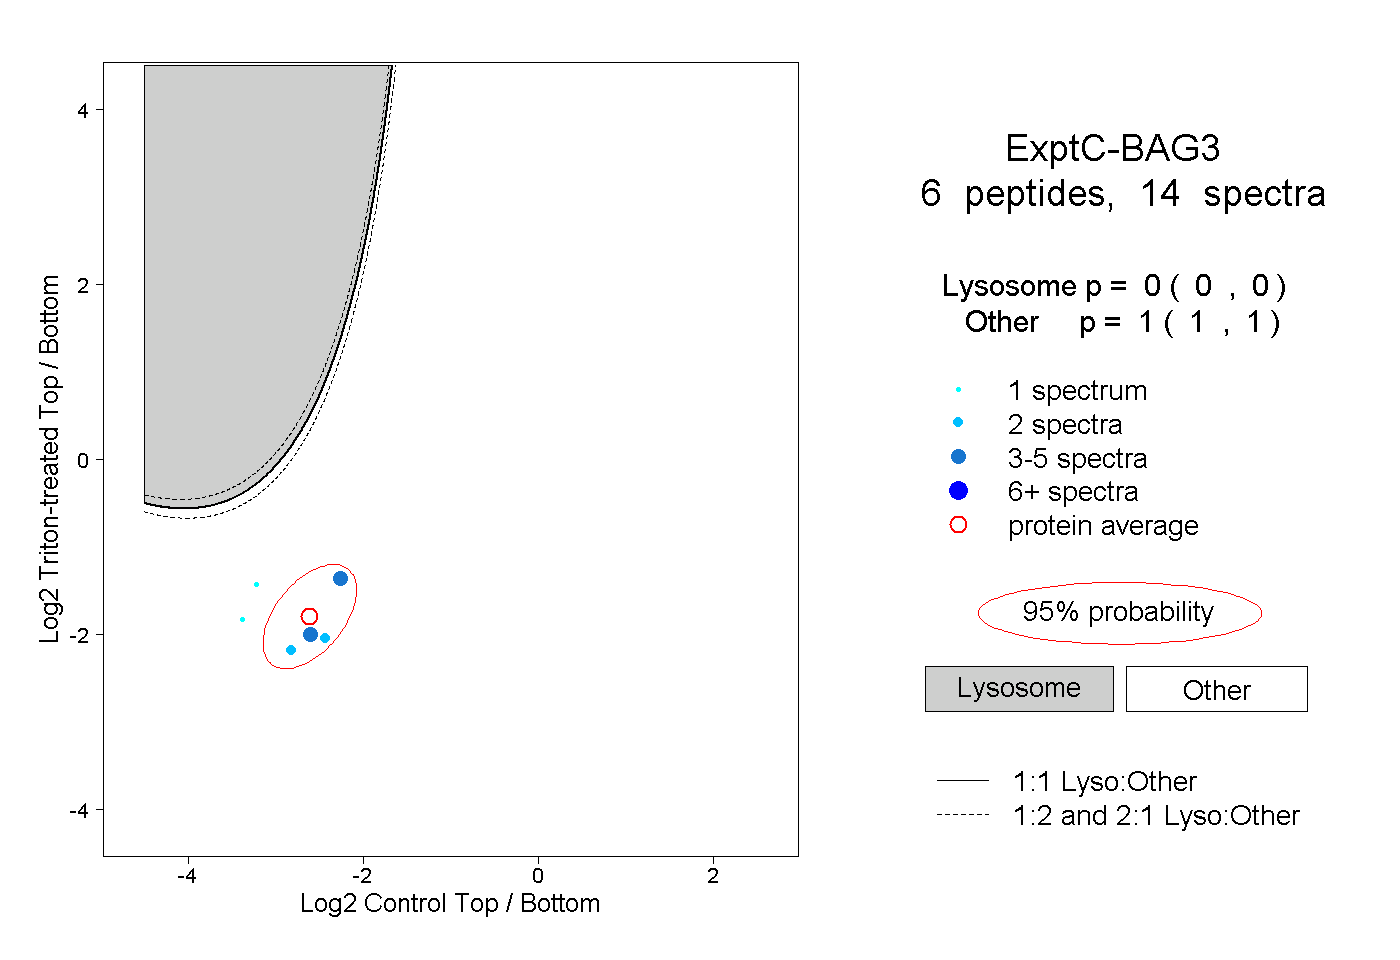 |
0.000 0.000 | 0.000 |
1.000 1.000 | 1.000 |
||||||||
| Plot | Lyso | Other | |||||||||||
| Expt D |
1 peptide |
2 spectra |
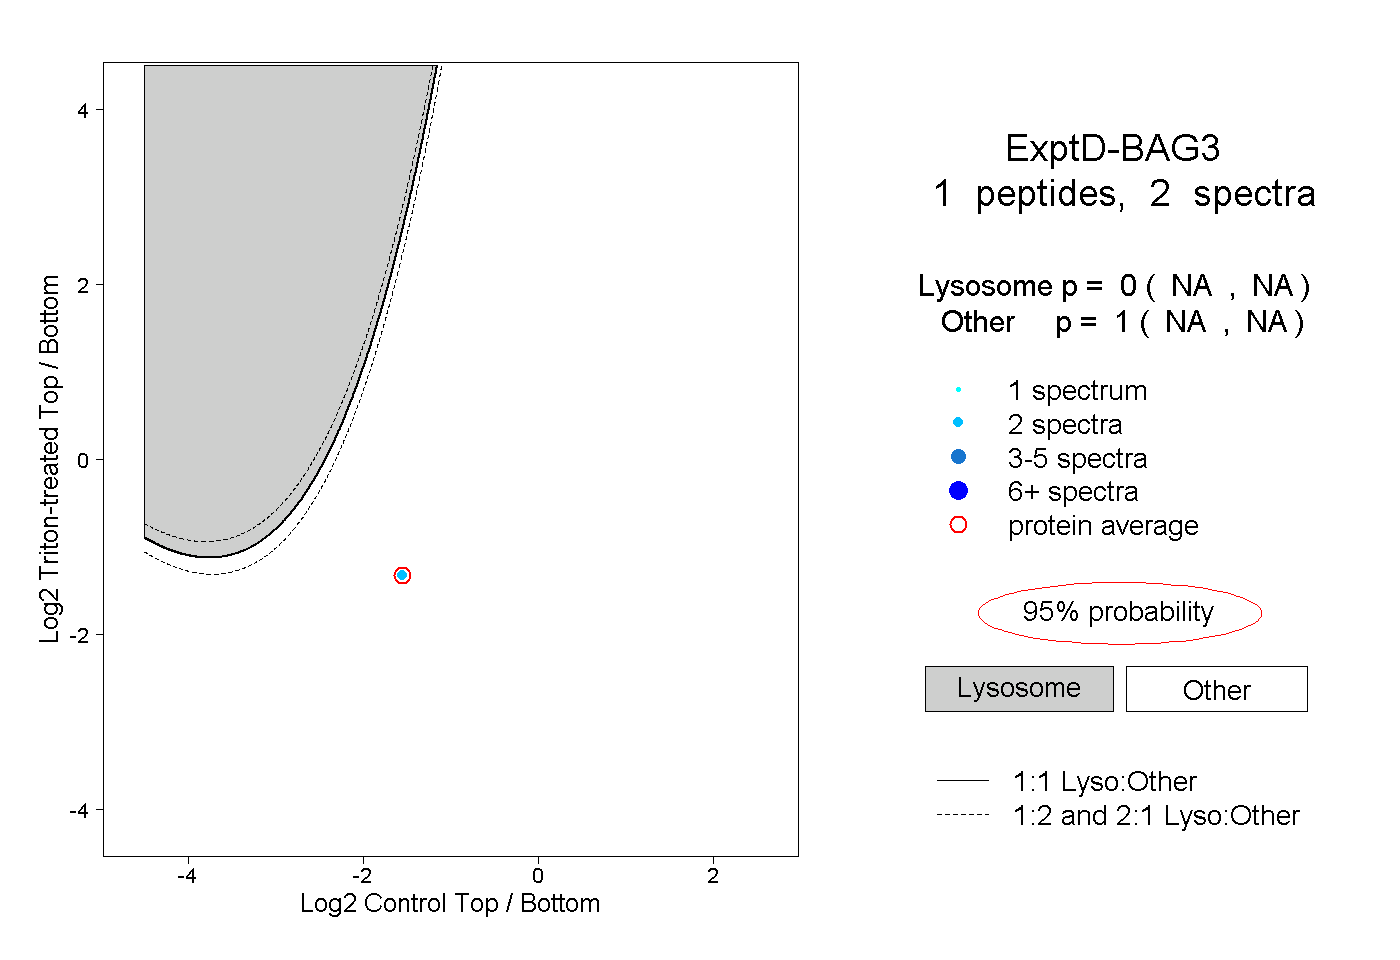 |
0.000 NA | NA |
1.000 NA | NA |