 6
6peptides
spectra
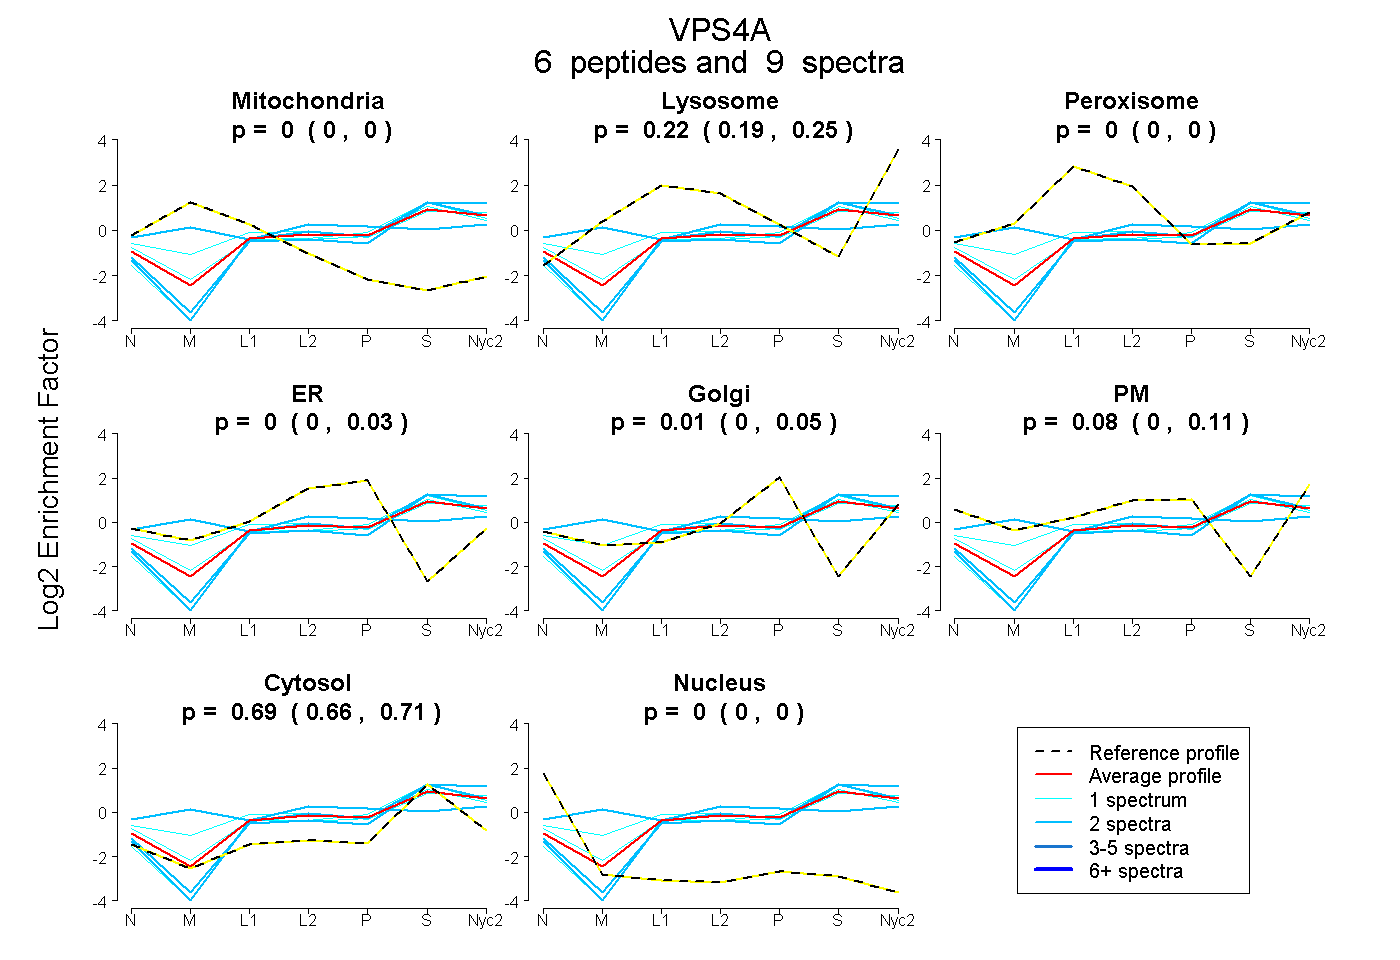
0.000 | 0.000
0.189 | 0.255
0.000 | 0.000
0.000 | 0.026
0.000 | 0.048
0.000 | 0.112
0.661 | 0.710
0.000 | 0.000
1peptide
spectrum
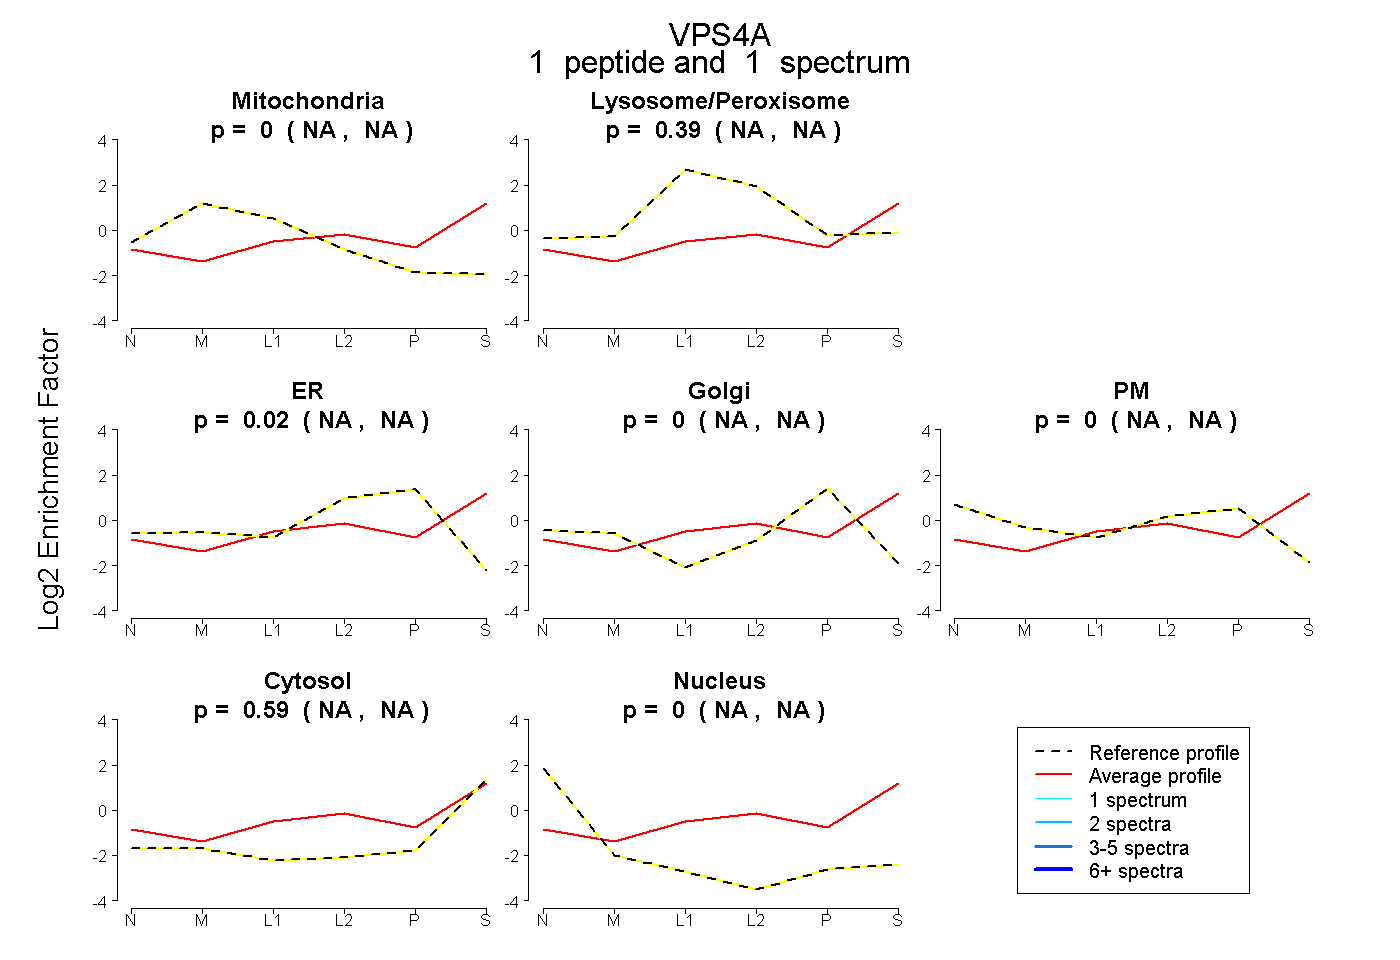
NA | NA
NA | NA
NA | NA
NA | NA
NA | NA
NA | NA
NA | NA
| Plot | Mito | Lyso | Perox | ER | Golgi | PM | Cytosol | Nucleus | |||||
| Expt A |
6 peptides |
9 spectra |
|
0.000 0.000 | 0.000 |
0.224 0.189 | 0.255 |
0.000 0.000 | 0.000 |
0.000 0.000 | 0.026 |
0.010 0.000 | 0.048 |
0.078 0.000 | 0.112 |
0.688 0.661 | 0.710 |
0.000 0.000 | 0.000 |
||
| Plot | Mito | Lyso or Perox | ER | Golgi | PM | Cytosol | Nucleus | ||||||
| Expt B |
1 peptide |
1 spectrum |
|
0.000 NA | NA |
0.386 NA | NA |
0.023 NA | NA |
0.000 NA | NA |
0.000 NA | NA |
0.590 NA | NA |
0.000 NA | NA |
| 1 spectrum, IYIPLPEEAAR | 0.000 | 0.386 | 0.023 | 0.000 | 0.000 | 0.590 | 0.000 |
| Plot | Lyso | Other | |||||||||||
| Expt C |
6 peptides |
16 spectra |
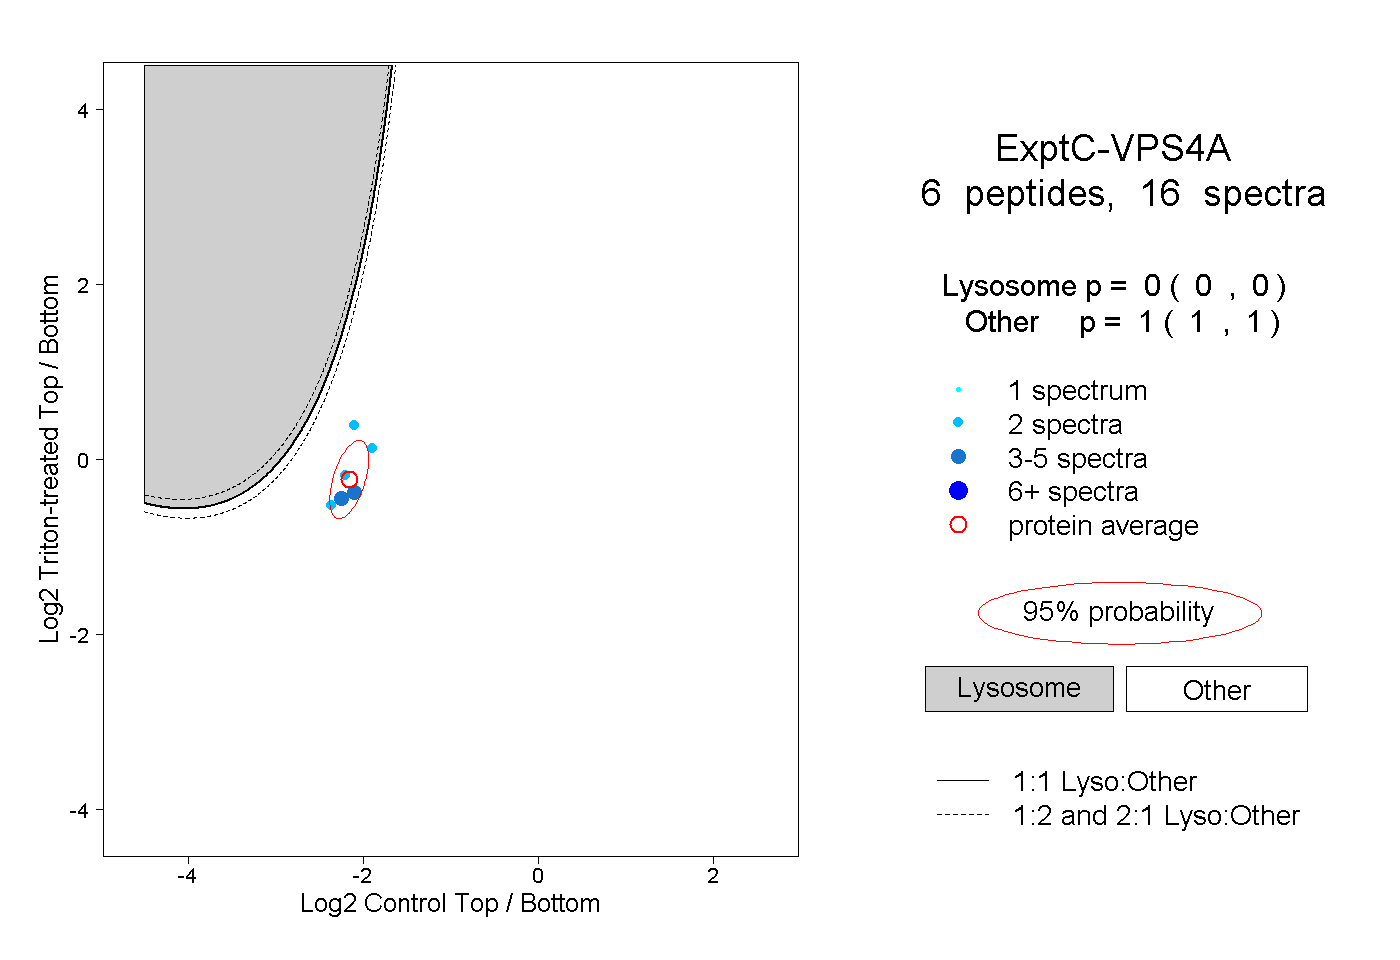 |
0.000 0.000 | 0.000 |
1.000 1.000 | 1.000 |