 6
6peptides
spectra
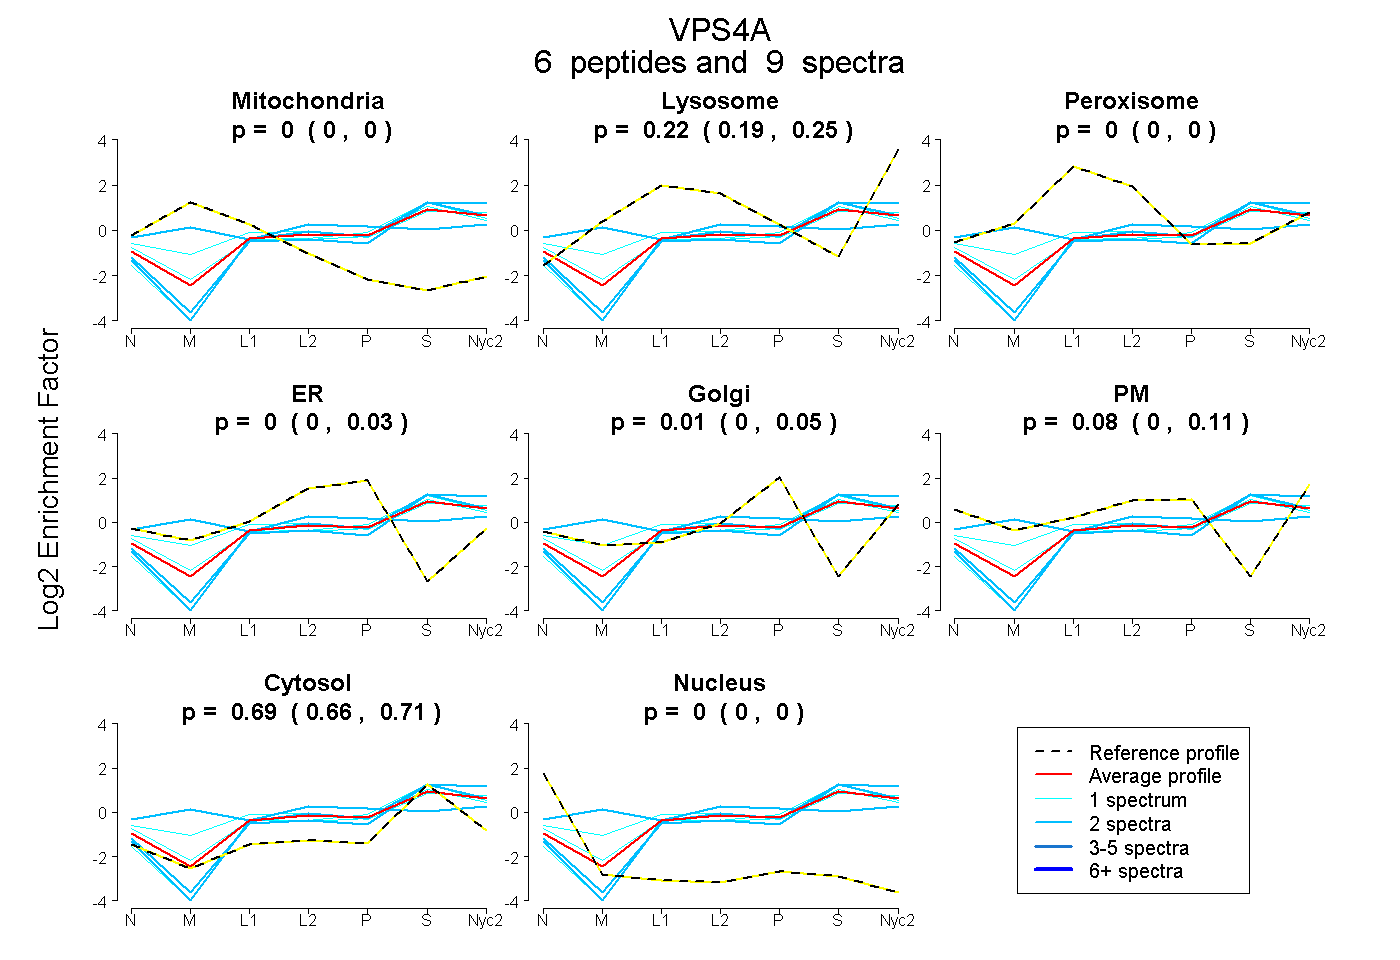
0.000 | 0.000
0.189 | 0.255
0.000 | 0.000
0.000 | 0.026
0.000 | 0.048
0.000 | 0.112
0.661 | 0.710
0.000 | 0.000
1peptide
spectrum
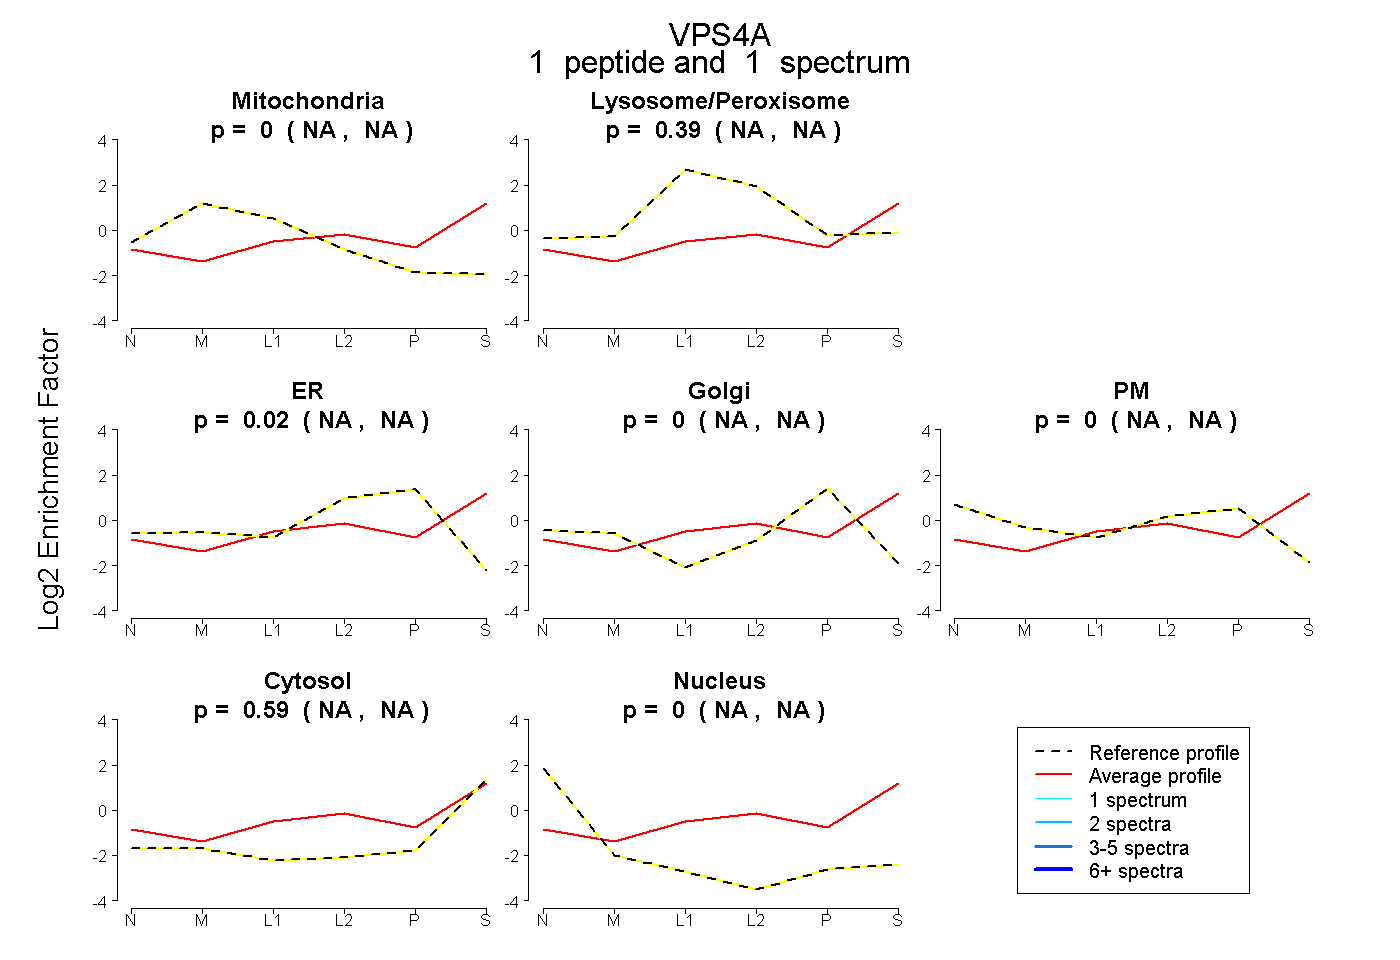
NA | NA
NA | NA
NA | NA
NA | NA
NA | NA
NA | NA
NA | NA
6peptides
spectra
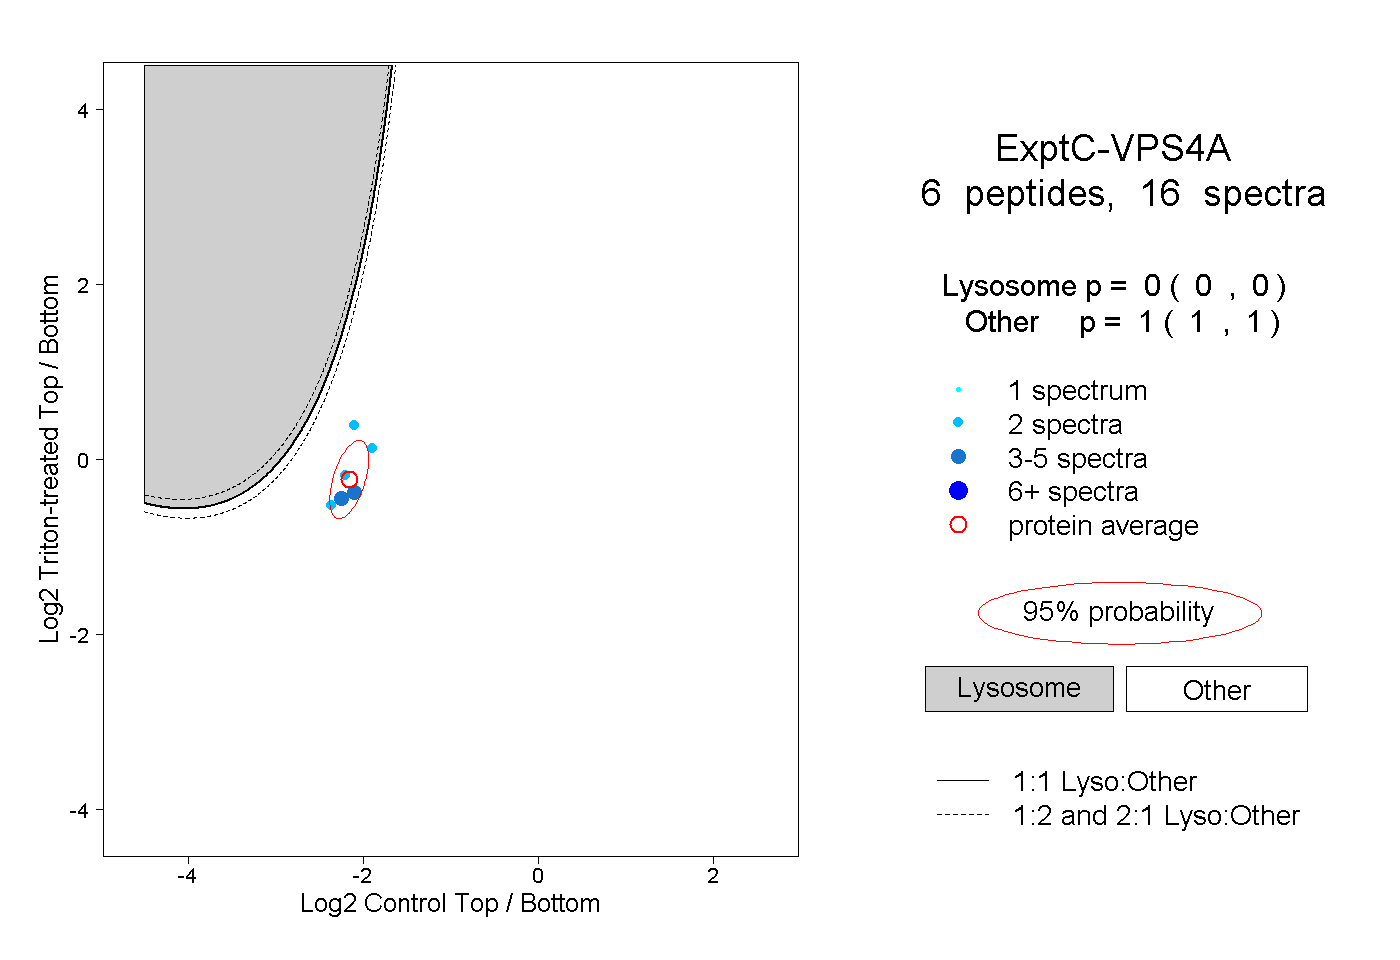
0.000 | 0.000
1.000 | 1.000