 3
3peptides
spectra
0.000 | 0.092
0.000 | 0.000
0.000 | 0.000
0.290 | 0.537
0.000 | 0.101
0.000 | 0.233
0.148 | 0.221
0.160 | 0.237
2peptides
spectra
0.000 | 0.000
1.000 | 1.000
| Plot | Mito | Lyso | Perox | ER | Golgi | PM | Cytosol | Nucleus | |||||
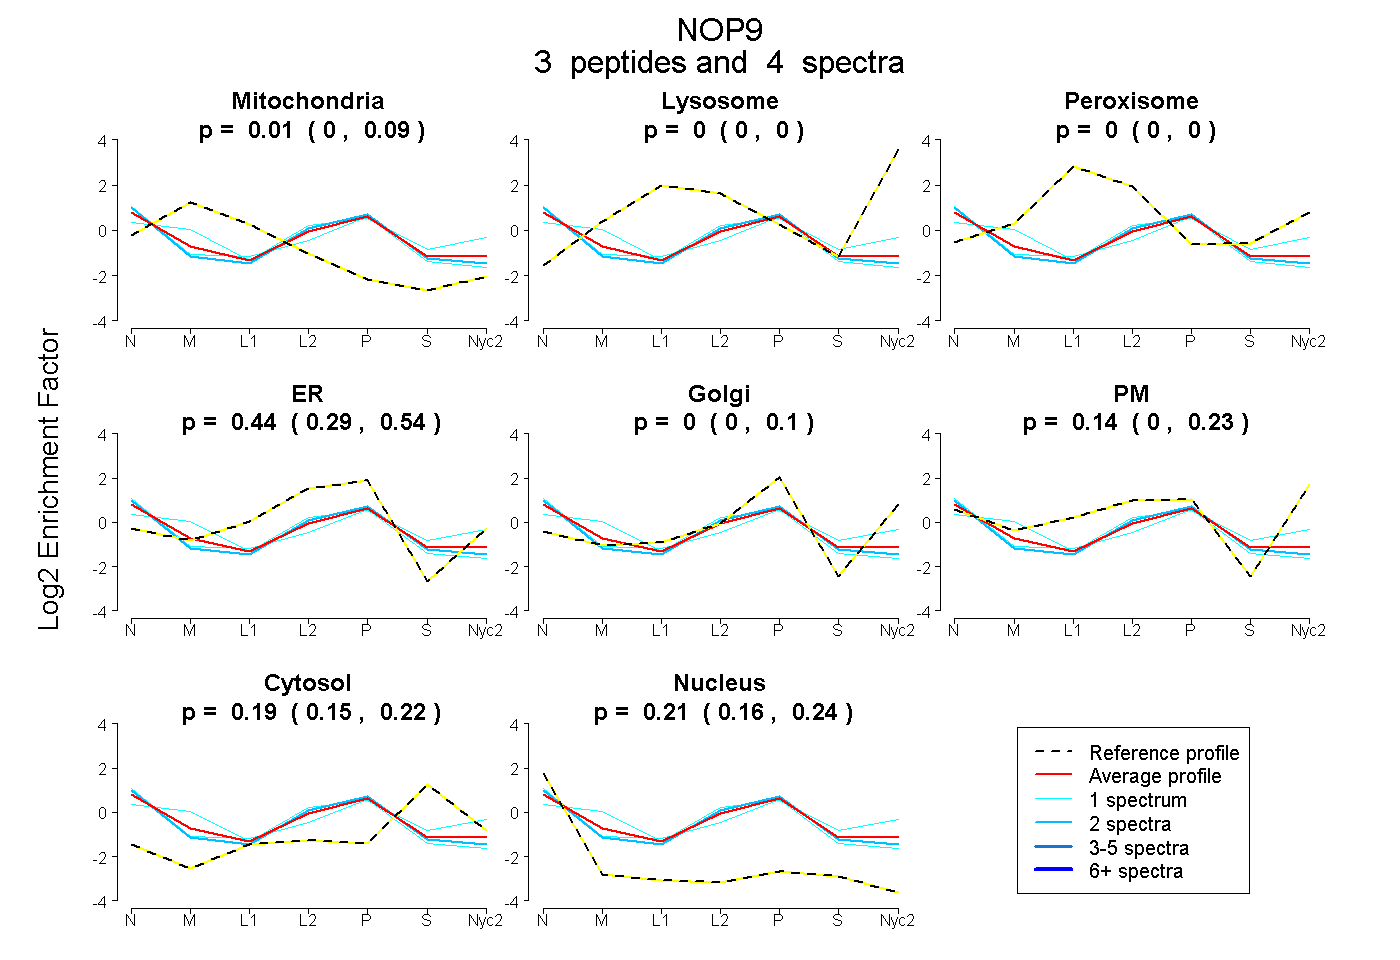
| Expt A |
3 peptides |
4 spectra |
|
0.011 0.000 | 0.092 |
0.000 0.000 | 0.000 |
0.000 0.000 | 0.000 |
0.442 0.290 | 0.537 |
0.000 0.000 | 0.101 |
0.143 0.000 | 0.233 |
0.193 0.148 | 0.221 |
0.212 0.160 | 0.237 |
||
| Plot | Lyso | Other | |||||||||||
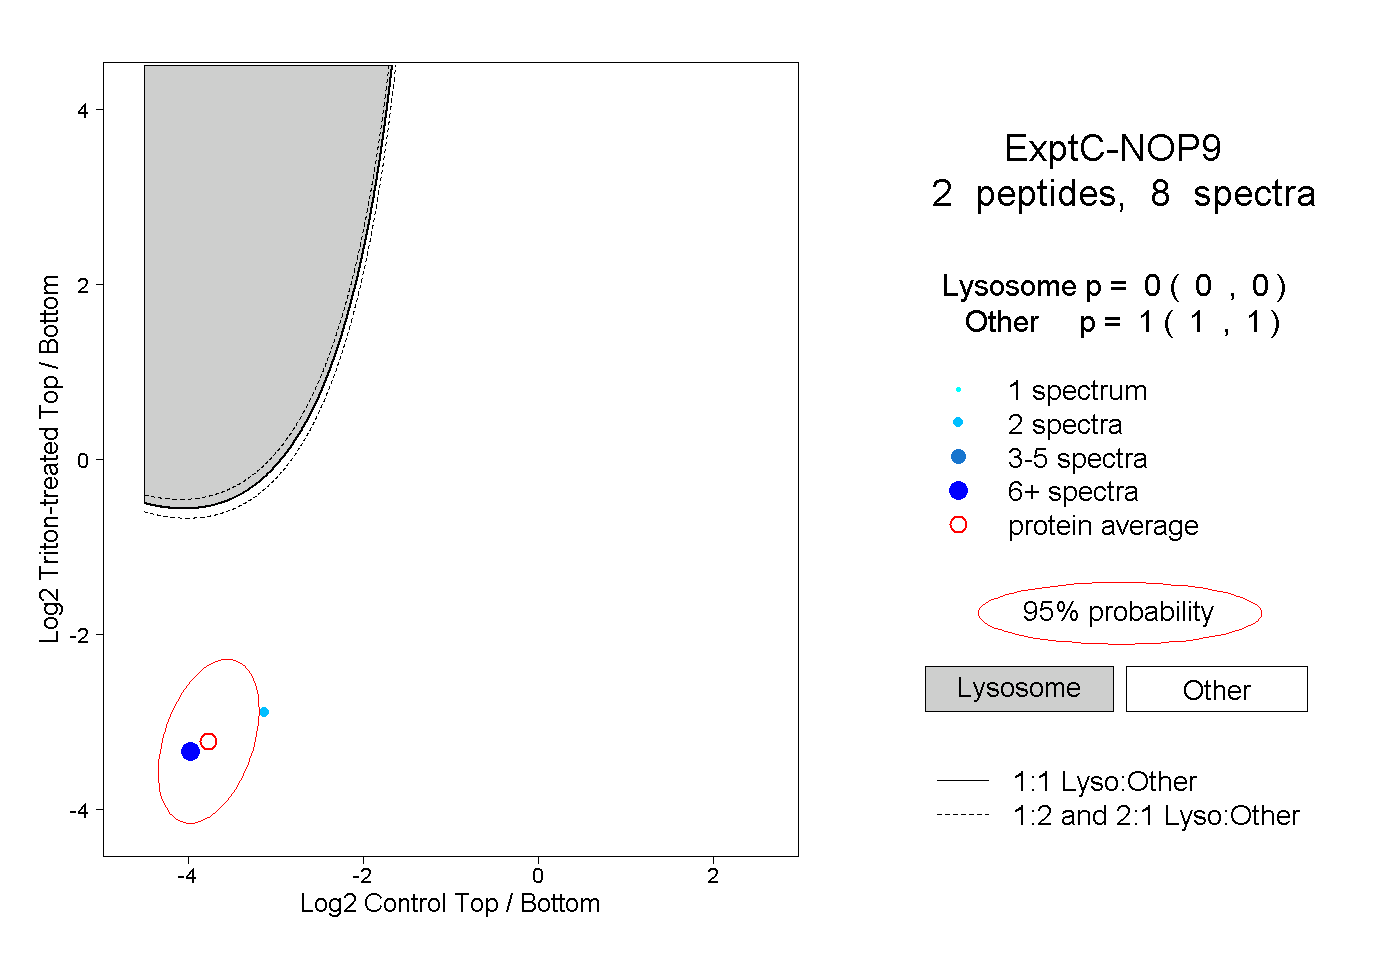
| Expt C |
2 peptides |
8 spectra |
|
0.000 0.000 | 0.000 |
1.000 1.000 | 1.000 |