 2
2peptides
spectra
0.000 | 0.253
0.000 | 0.000
0.000 | 0.255
0.000 | 0.395
0.000 | 0.213
0.000 | 0.090
0.234 | 0.389
0.027 | 0.217
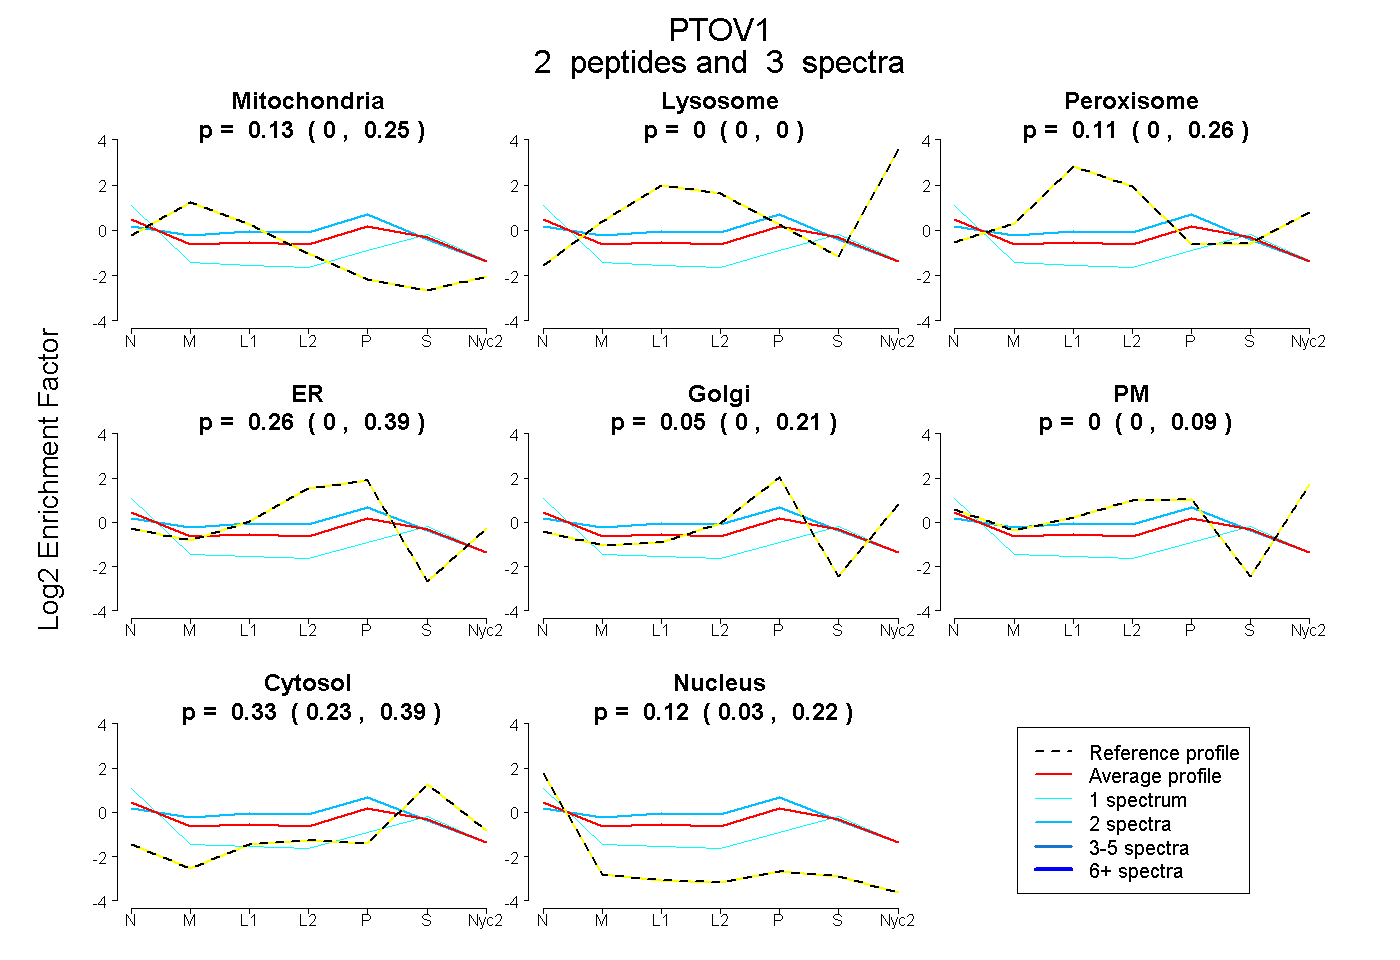
| Plot | Mito | Lyso | Perox | ER | Golgi | PM | Cytosol | Nucleus | |||||
| Expt A |
2 peptides |
3 spectra |
|
0.131 0.000 | 0.253 |
0.000 0.000 | 0.000 |
0.105 0.000 | 0.255 |
0.258 0.000 | 0.395 |
0.055 0.000 | 0.213 |
0.000 0.000 | 0.090 |
0.328 0.234 | 0.389 |
0.124 0.027 | 0.217 |