 2
2peptides
spectra
NA | NA
NA | NA
NA | NA
NA | NA
NA | NA
NA | NA
NA | NA
NA | NA
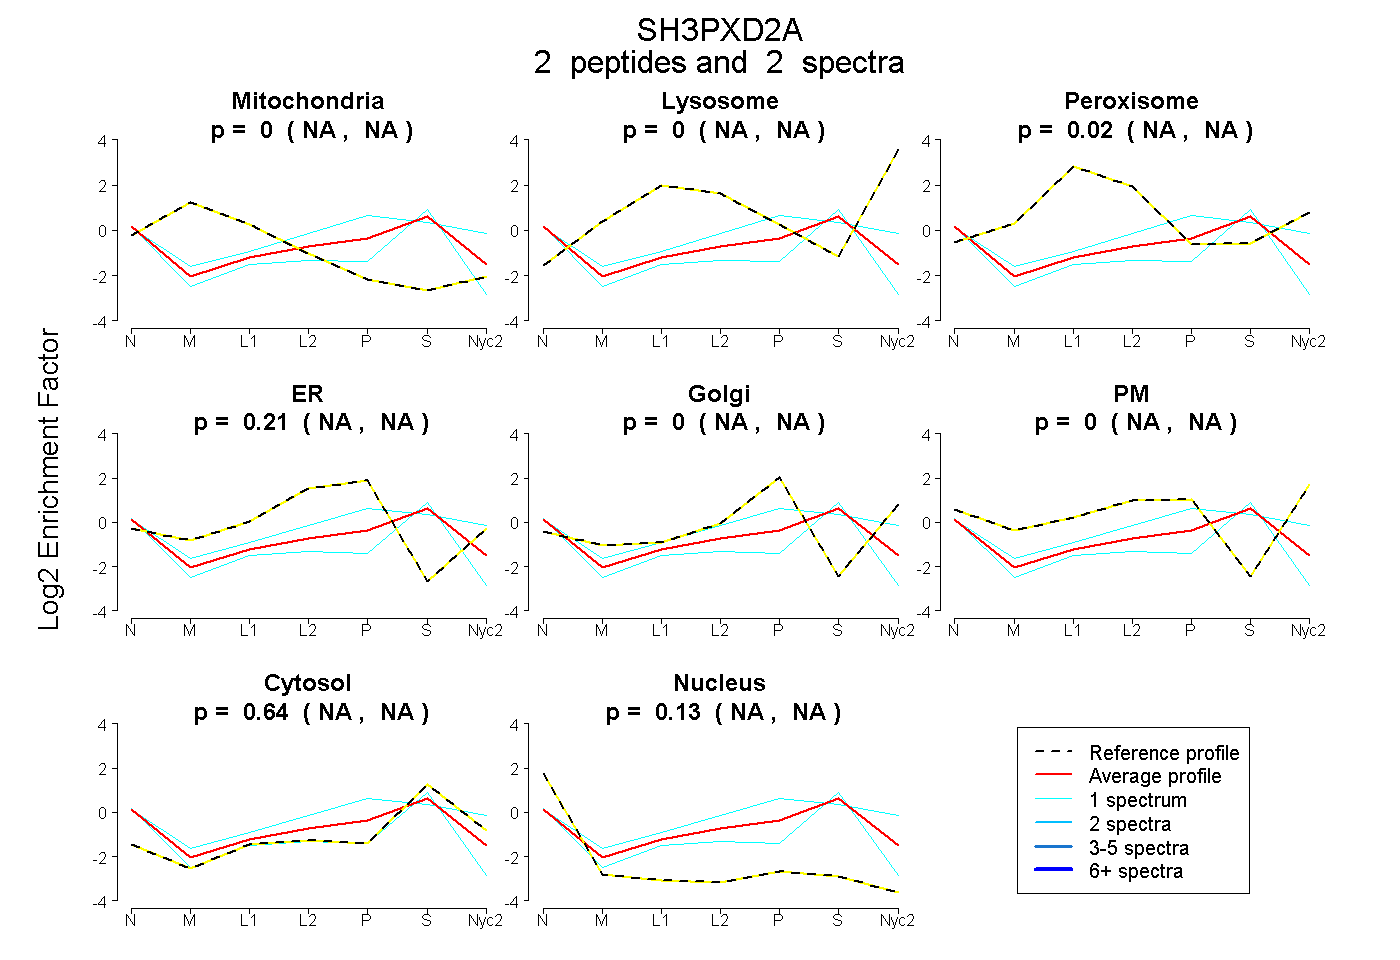
| Plot | Mito | Lyso | Perox | ER | Golgi | PM | Cytosol | Nucleus | |||||
| Expt A |
2 peptides |
2 spectra |
|
0.000 NA | NA |
0.000 NA | NA |
0.021 NA | NA |
0.209 NA | NA |
0.000 NA | NA |
0.000 NA | NA |
0.640 NA | NA |
0.130 NA | NA |
| 1 spectrum, QLRPTGQLR | 0.000 | 0.000 | 0.000 | 0.149 | 0.083 | 0.233 | 0.535 | 0.000 | ||
| 1 spectrum, TGLASCVR | 0.000 | 0.000 | 0.028 | 0.000 | 0.000 | 0.000 | 0.681 | 0.292 |
| Plot | Lyso | Other | |||||||||||
| Expt C |
1 peptide |
1 spectrum |
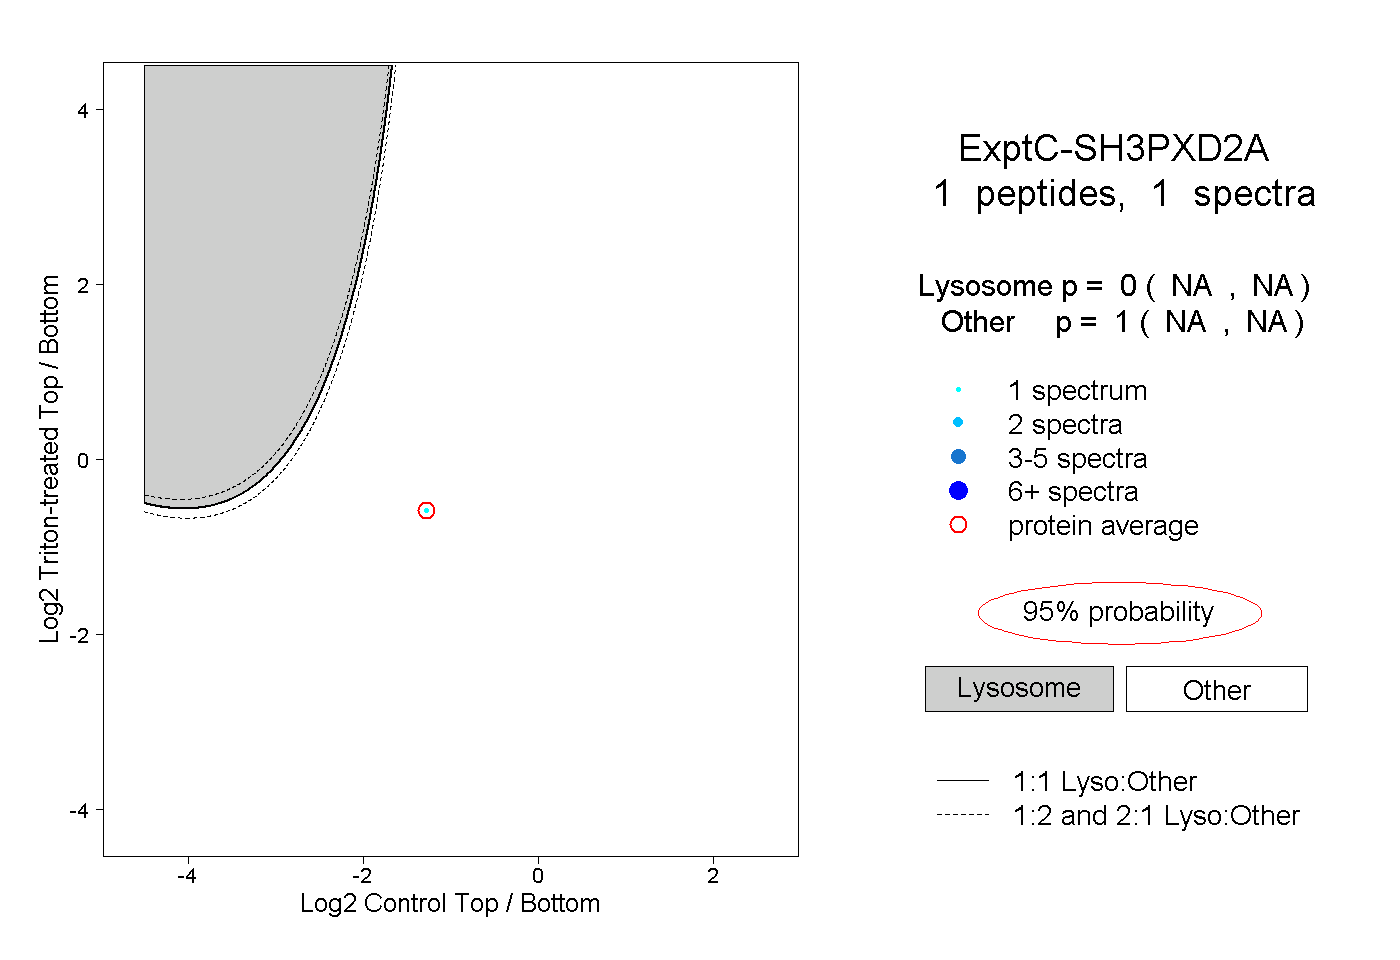 |
0.000 NA | NA |
1.000 NA | NA |