 6
6peptides
spectra
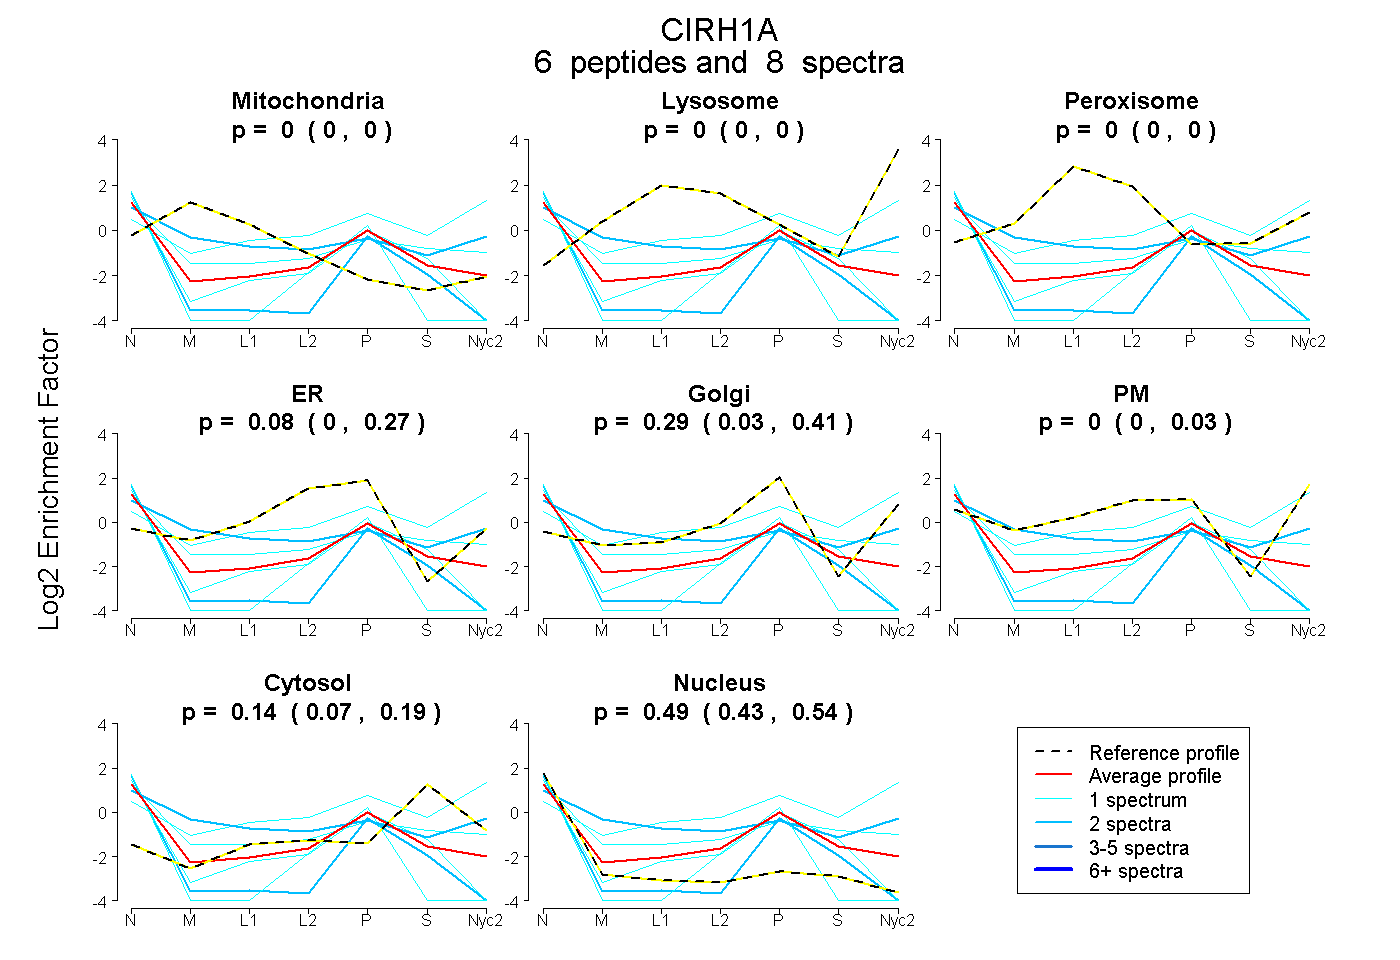
0.000 | 0.000
0.000 | 0.000
0.000 | 0.000
0.000 | 0.273
0.031 | 0.407
0.000 | 0.029
0.069 | 0.193
0.428 | 0.541
| Plot | Mito | Lyso | Perox | ER | Golgi | PM | Cytosol | Nucleus | |||||
| Expt A |
6 peptides |
8 spectra |
|
0.000 0.000 | 0.000 |
0.000 0.000 | 0.000 |
0.000 0.000 | 0.000 |
0.081 0.000 | 0.273 |
0.295 0.031 | 0.407 |
0.000 0.000 | 0.029 |
0.135 0.069 | 0.193 |
0.490 0.428 | 0.541 |
| 1 spectrum, QGFHQLWLQR | 0.000 | 0.012 | 0.000 | 0.000 | 0.000 | 0.629 | 0.359 | 0.000 | ||
| 2 spectra, LPAFLR | 0.000 | 0.000 | 0.000 | 0.000 | 0.077 | 0.000 | 0.037 | 0.886 | ||
| 1 spectrum, FFNYVPSGIR | 0.000 | 0.000 | 0.000 | 0.000 | 0.000 | 0.377 | 0.290 | 0.333 | ||
| 2 spectra, VQLWDSATGTLVK | 0.180 | 0.000 | 0.000 | 0.000 | 0.000 | 0.460 | 0.203 | 0.157 | ||
| 1 spectrum, NADHLLHLK | 0.000 | 0.000 | 0.000 | 0.173 | 0.000 | 0.000 | 0.000 | 0.827 | ||
| 1 spectrum, LTFPHR | 0.000 | 0.000 | 0.000 | 0.193 | 0.000 | 0.000 | 0.157 | 0.650 |
| Plot | Lyso | Other | |||||||||||
| Expt C |
1 peptide |
2 spectra |
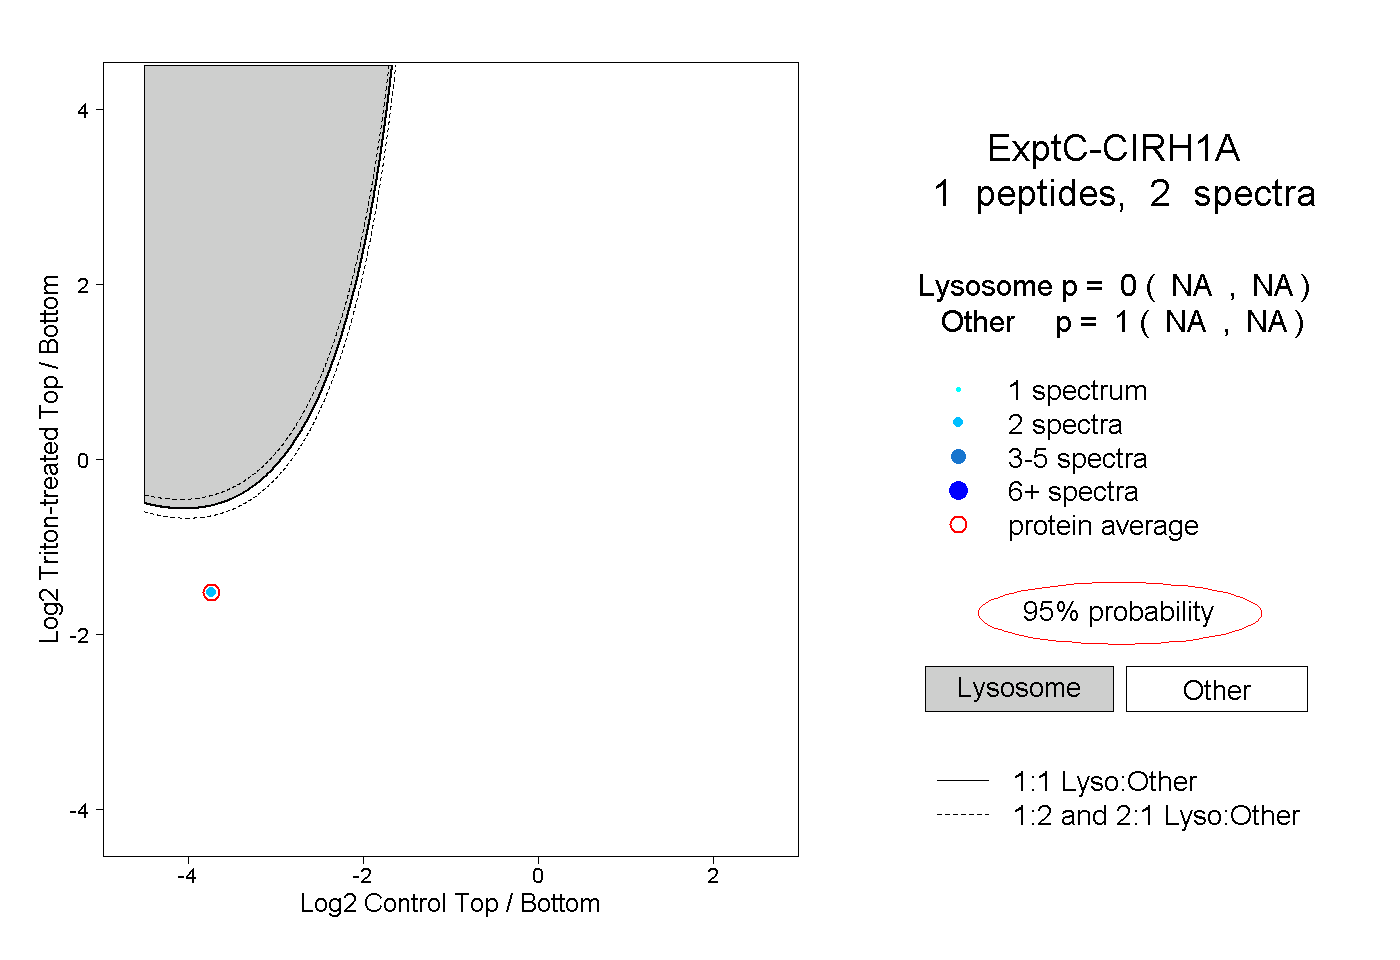 |
0.000 NA | NA |
1.000 NA | NA |