 1
1peptide
spectra
0.085 | 0.352
0.156 | 0.318
0.000 | 0.154
0.000 | 0.000
0.000 | 0.150
0.167 | 0.400
0.000 | 0.275
0.000 | 0.000
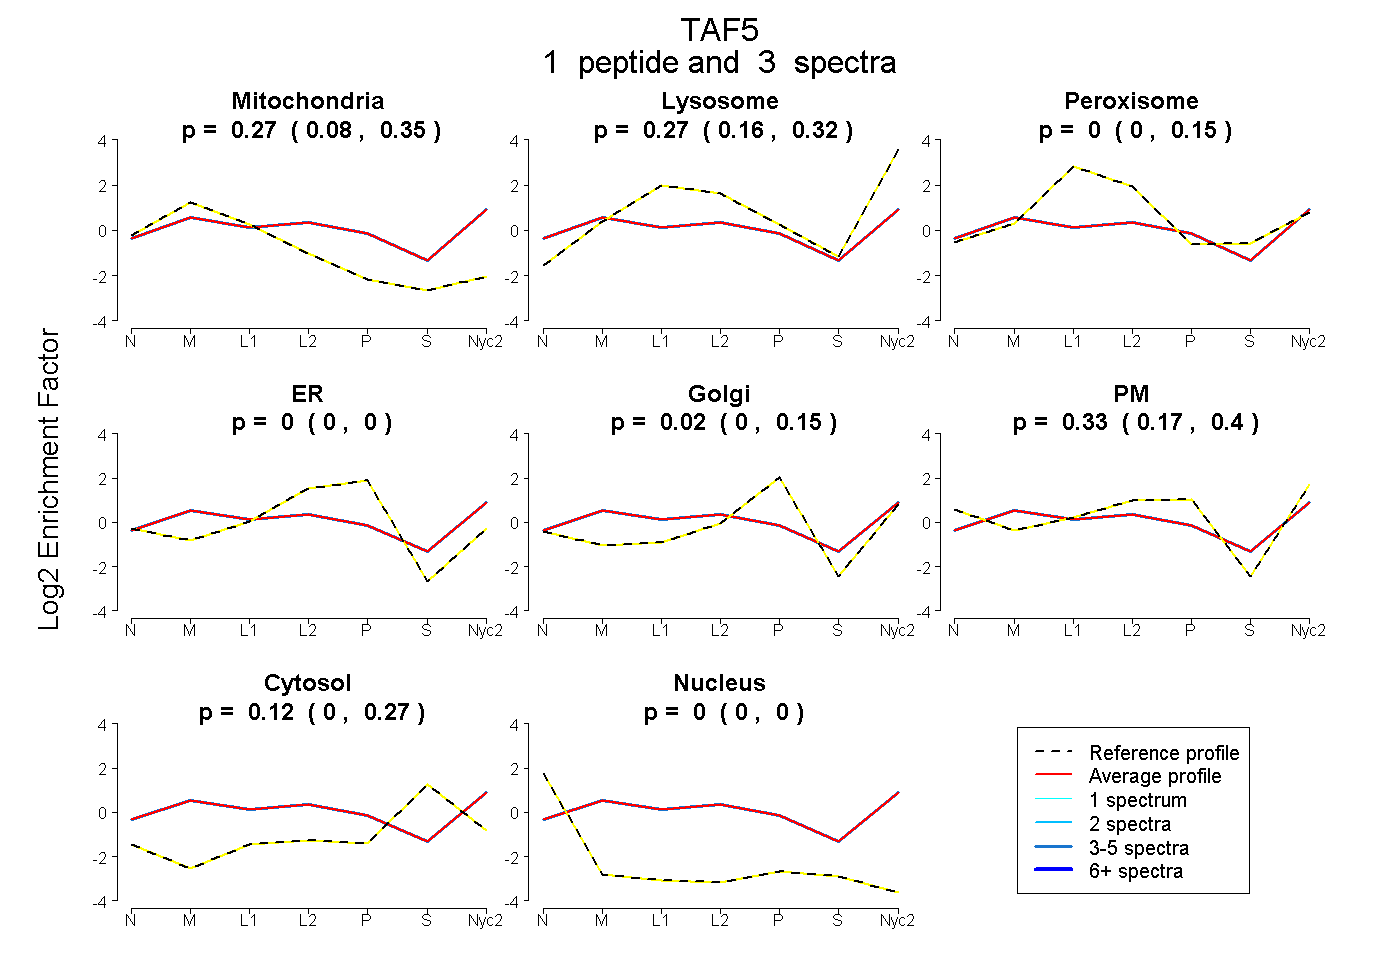
| Plot | Mito | Lyso | Perox | ER | Golgi | PM | Cytosol | Nucleus | |||||
| Expt A |
1 peptide |
3 spectra |
|
0.267 0.085 | 0.352 |
0.268 0.156 | 0.318 |
0.000 0.000 | 0.154 |
0.000 0.000 | 0.000 |
0.016 0.000 | 0.150 |
0.328 0.167 | 0.400 |
0.120 0.000 | 0.275 |
0.000 0.000 | 0.000 |