 11
11peptides
spectra
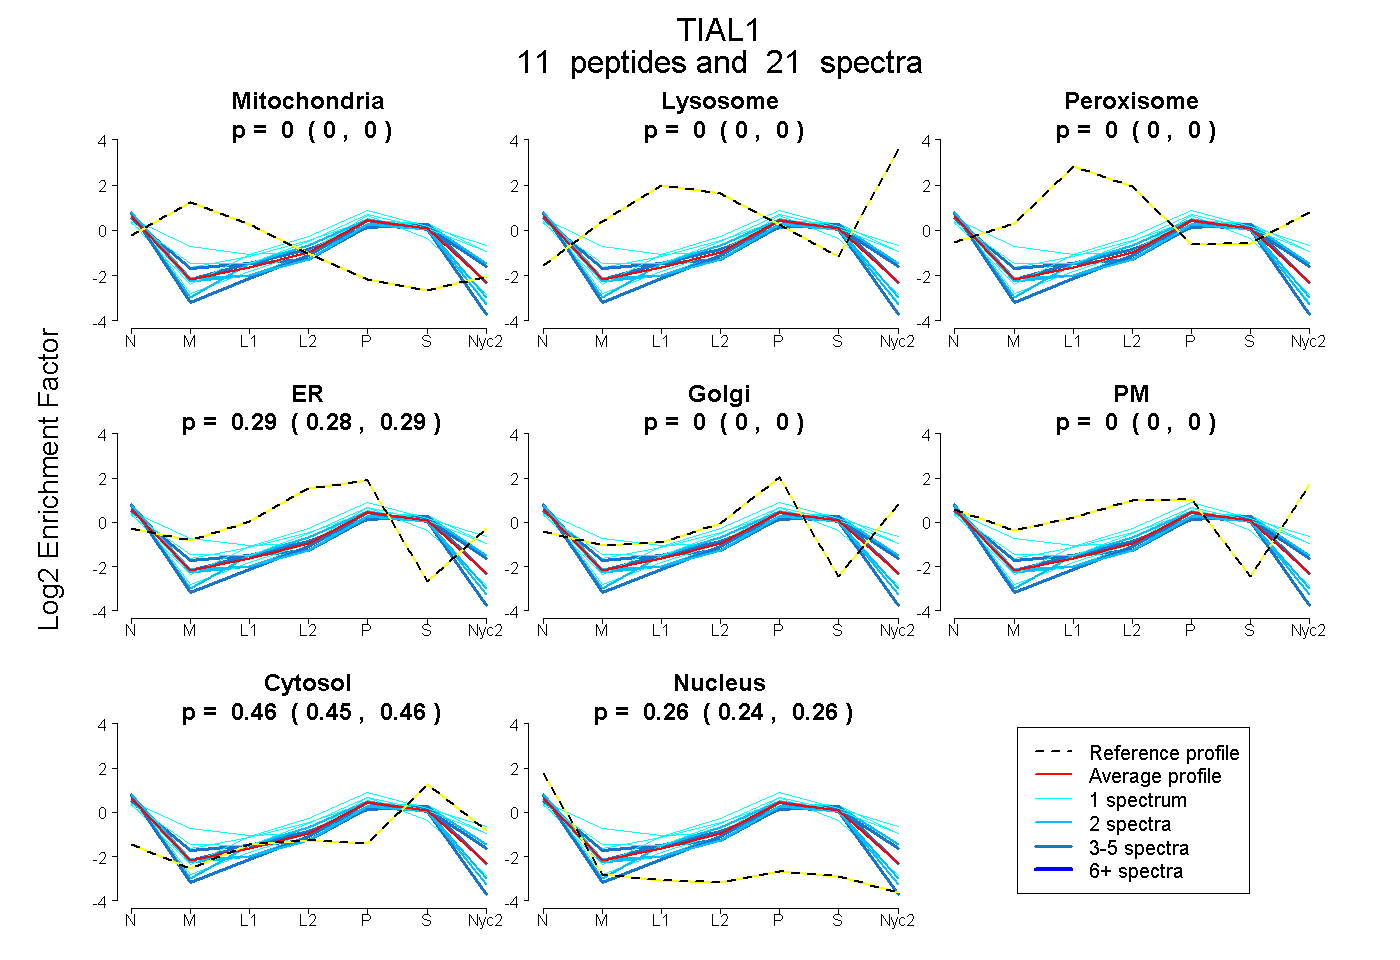
0.000 | 0.000
0.000 | 0.000
0.000 | 0.000
0.281 | 0.294
0.000 | 0.000
0.000 | 0.000
0.448 | 0.463
0.245 | 0.264
| Plot | Mito | Lyso | Perox | ER | Golgi | PM | Cytosol | Nucleus | |||||
| Expt A |
11 peptides |
21 spectra |
|
0.000 0.000 | 0.000 |
0.000 0.000 | 0.000 |
0.000 0.000 | 0.000 |
0.288 0.281 | 0.294 |
0.000 0.000 | 0.000 |
0.000 0.000 | 0.000 |
0.456 0.448 | 0.463 |
0.256 0.245 | 0.264 |
| 2 spectra, TLYVGNLSR | 0.000 | 0.000 | 0.000 | 0.223 | 0.000 | 0.000 | 0.397 | 0.380 | ||
| 1 spectrum, QTFSPFGQIMEIR | 0.000 | 0.000 | 0.000 | 0.253 | 0.000 | 0.000 | 0.396 | 0.351 | ||
| 1 spectrum, KPPAPK | 0.116 | 0.000 | 0.000 | 0.363 | 0.000 | 0.000 | 0.294 | 0.227 | ||
| 1 spectrum, DAAAALAAMNGR | 0.000 | 0.000 | 0.000 | 0.291 | 0.039 | 0.061 | 0.538 | 0.070 | ||
| 1 spectrum, MITEQPDSR | 0.000 | 0.000 | 0.000 | 0.261 | 0.189 | 0.000 | 0.514 | 0.036 | ||
| 4 spectra, GYGFVSFYNK | 0.000 | 0.000 | 0.000 | 0.167 | 0.114 | 0.000 | 0.483 | 0.236 | ||
| 2 spectra, SAFAPFGK | 0.000 | 0.000 | 0.000 | 0.276 | 0.000 | 0.000 | 0.424 | 0.300 | ||
| 1 spectrum, VNWATTPSSQK | 0.000 | 0.000 | 0.000 | 0.230 | 0.217 | 0.000 | 0.458 | 0.095 | ||
| 3 spectra, LDAENAIVHMGGQWLGGR | 0.000 | 0.000 | 0.000 | 0.281 | 0.000 | 0.000 | 0.491 | 0.228 | ||
| 3 spectra, STQETNTK | 0.000 | 0.000 | 0.000 | 0.187 | 0.000 | 0.000 | 0.399 | 0.414 | ||
| 2 spectra, GYSFVR | 0.000 | 0.000 | 0.000 | 0.070 | 0.213 | 0.000 | 0.502 | 0.215 |
| Plot | Mito | Lyso or Perox | ER | Golgi | PM | Cytosol | Nucleus | ||||||
| Expt B |
2 peptides |
2 spectra |
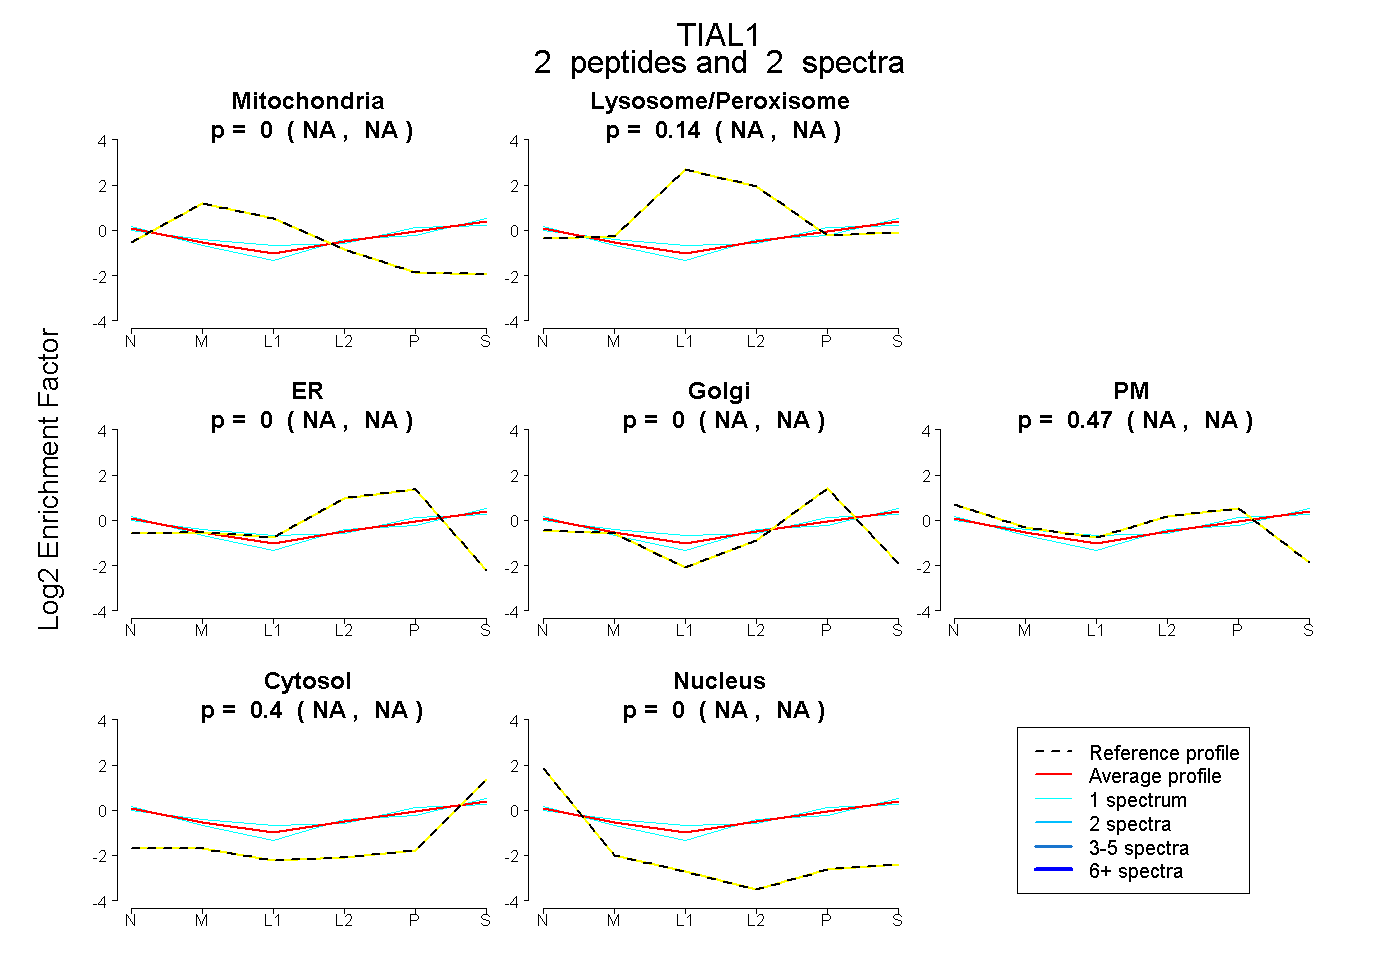 |
0.000 NA | NA |
0.136 NA | NA |
0.000 NA | NA |
0.000 NA | NA |
0.468 NA | NA |
0.395 NA | NA |
0.000 NA | NA |
|||
| Plot | Lyso | Other | |||||||||||
| Expt C |
4 peptides |
9 spectra |
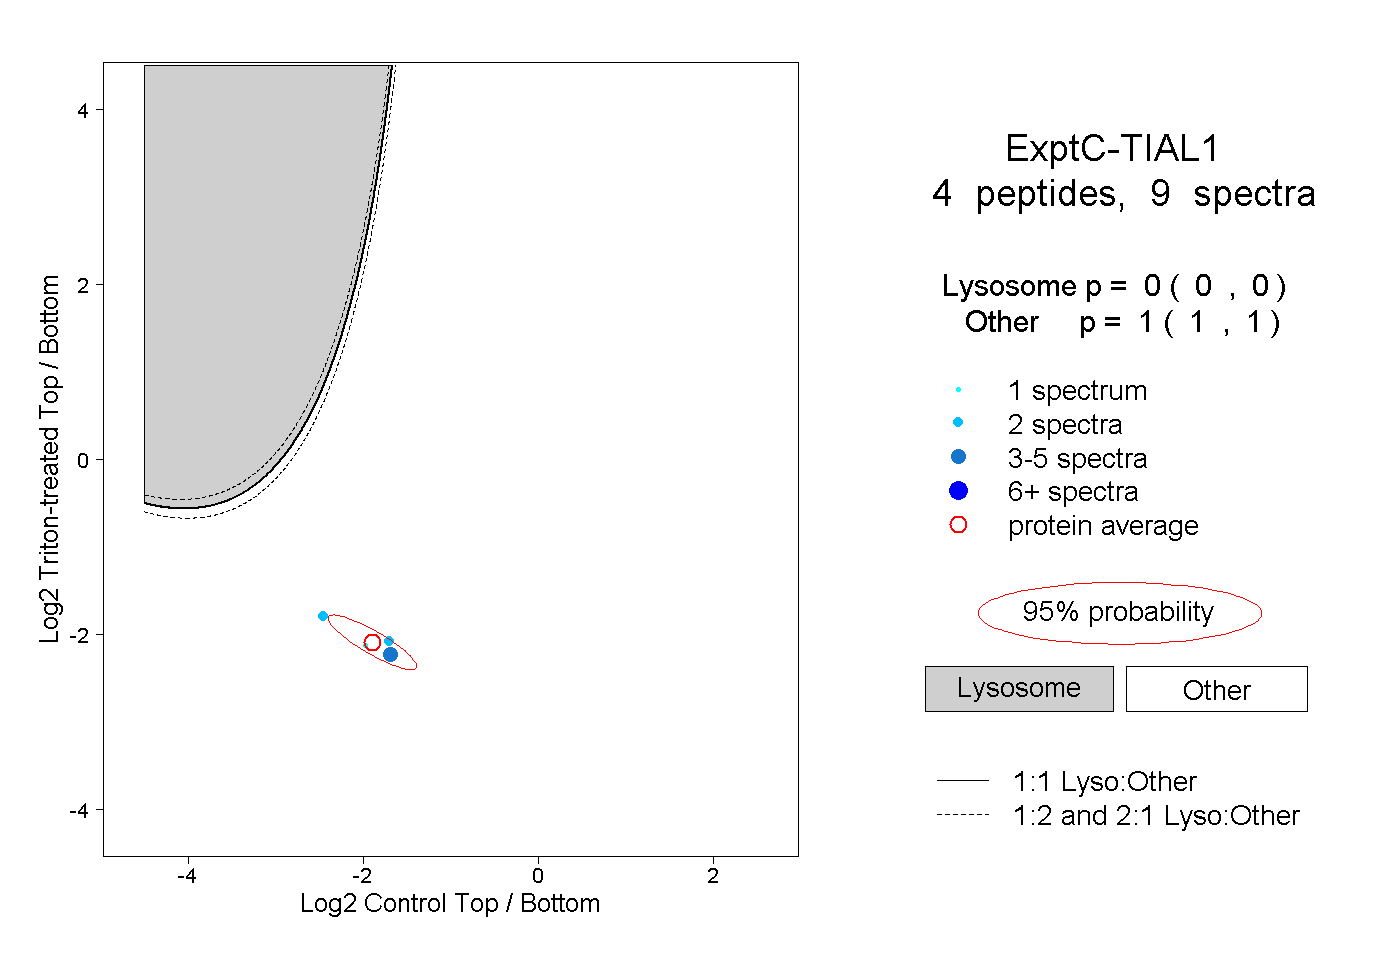 |
0.000 0.000 | 0.000 |
1.000 1.000 | 1.000 |