 9
9peptides
spectra
0.000 | 0.000
0.117 | 0.149
0.000 | 0.000
0.000 | 0.000
0.000 | 0.000
0.000 | 0.026
0.842 | 0.864
0.000 | 0.000
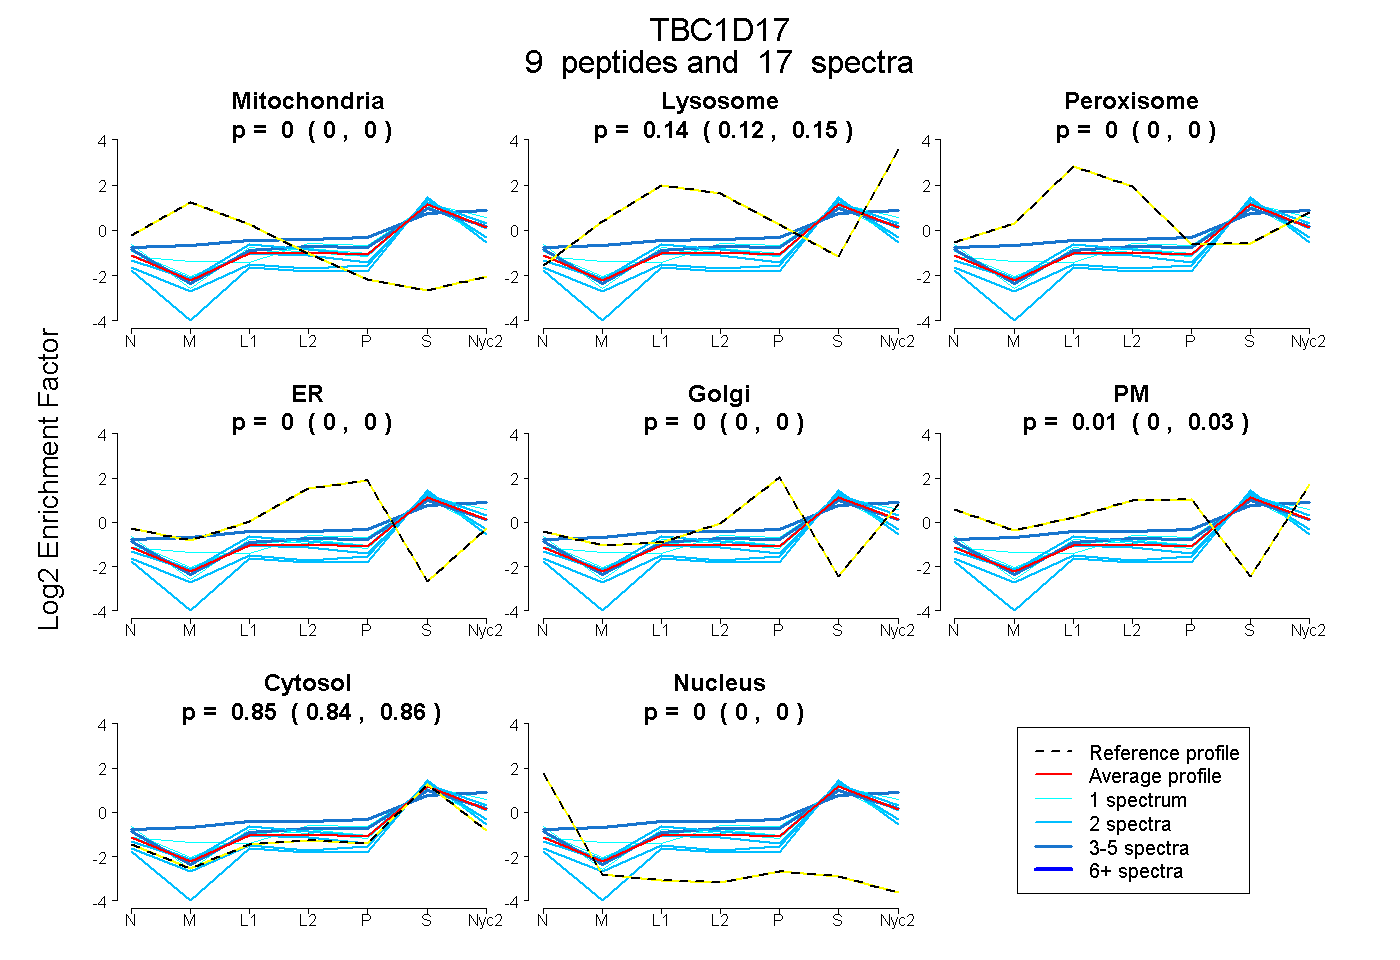
| Plot | Mito | Lyso | Perox | ER | Golgi | PM | Cytosol | Nucleus | |||||
| Expt A |
9 peptides |
17 spectra |
|
0.000 0.000 | 0.000 |
0.136 0.117 | 0.149 |
0.000 0.000 | 0.000 |
0.000 0.000 | 0.000 |
0.000 0.000 | 0.000 |
0.010 0.000 | 0.026 |
0.854 0.842 | 0.864 |
0.000 0.000 | 0.000 |
| 3 spectra, IFSGGLSPGLR | 0.000 | 0.287 | 0.000 | 0.000 | 0.000 | 0.132 | 0.580 | 0.000 | ||
| 2 spectra, YLLLASSPQDSR | 0.000 | 0.187 | 0.000 | 0.000 | 0.000 | 0.000 | 0.813 | 0.000 | ||
| 2 spectra, SVSAEQER | 0.000 | 0.125 | 0.000 | 0.000 | 0.000 | 0.000 | 0.875 | 0.000 | ||
| 1 spectrum, APPVTEEEWNR | 0.000 | 0.184 | 0.000 | 0.000 | 0.000 | 0.020 | 0.796 | 0.000 | ||
| 1 spectrum, HVGPEGR | 0.003 | 0.086 | 0.000 | 0.045 | 0.029 | 0.045 | 0.793 | 0.000 | ||
| 1 spectrum, AEALYR | 0.000 | 0.111 | 0.000 | 0.000 | 0.000 | 0.057 | 0.833 | 0.000 | ||
| 3 spectra, VTNFFR | 0.000 | 0.087 | 0.000 | 0.000 | 0.000 | 0.118 | 0.795 | 0.000 | ||
| 2 spectra, EFPFPDVLR | 0.000 | 0.000 | 0.000 | 0.000 | 0.000 | 0.000 | 1.000 | 0.000 | ||
| 2 spectra, LSVEDVLTR | 0.000 | 0.000 | 0.000 | 0.000 | 0.000 | 0.000 | 1.000 | 0.000 |
| Plot | Mito | Lyso or Perox | ER | Golgi | PM | Cytosol | Nucleus | ||||||
| Expt B |
2 peptides |
2 spectra |
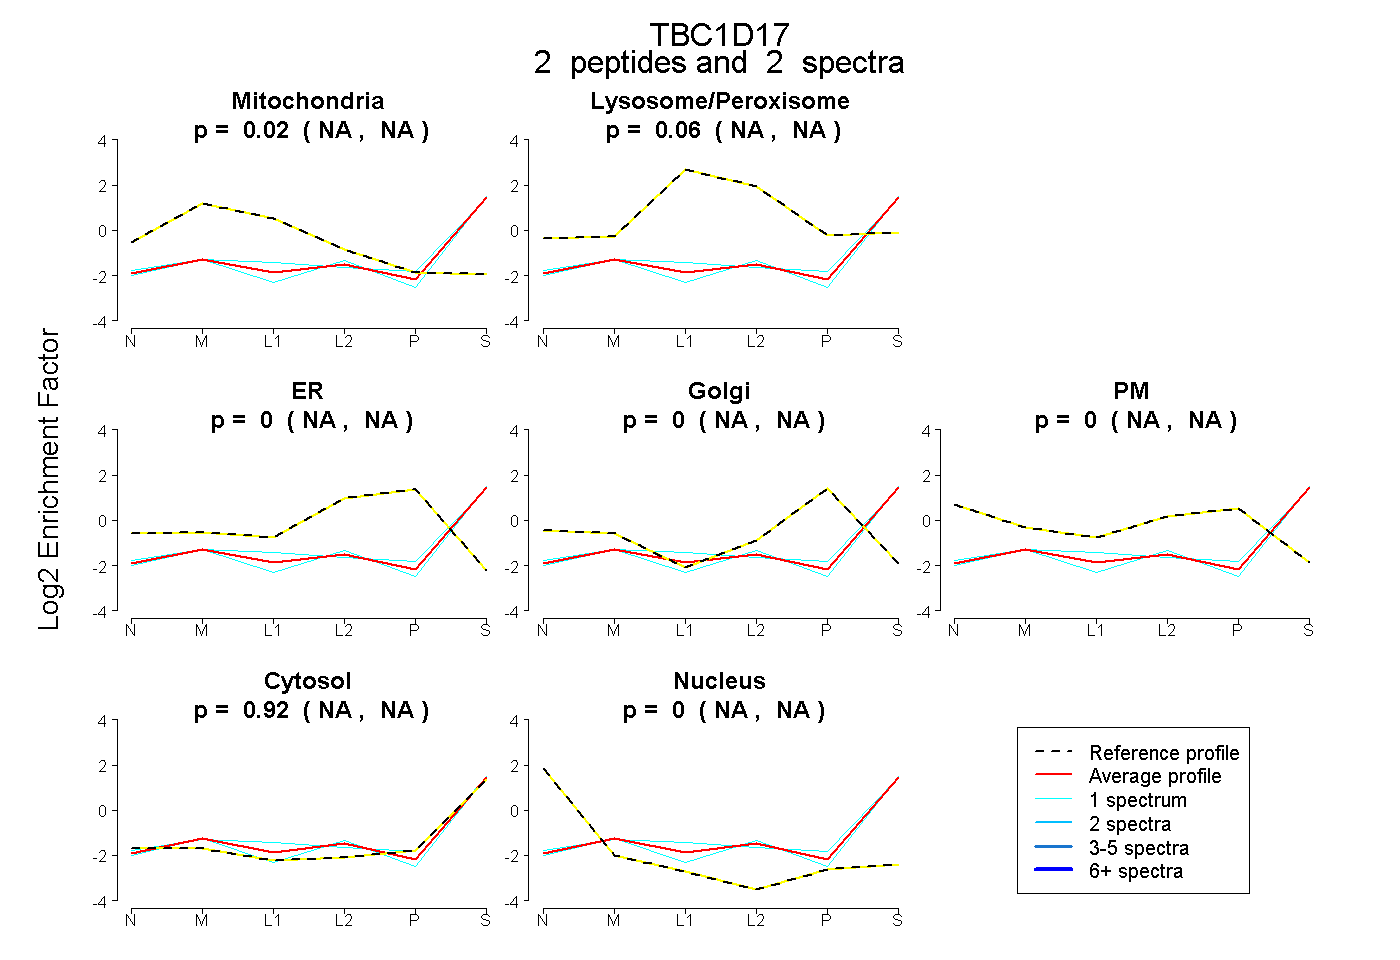 |
0.018 NA | NA |
0.065 NA | NA |
0.000 NA | NA |
0.000 NA | NA |
0.000 NA | NA |
0.917 NA | NA |
0.000 NA | NA |
|||
| Plot | Lyso | Other | |||||||||||
| Expt C |
5 peptides |
12 spectra |
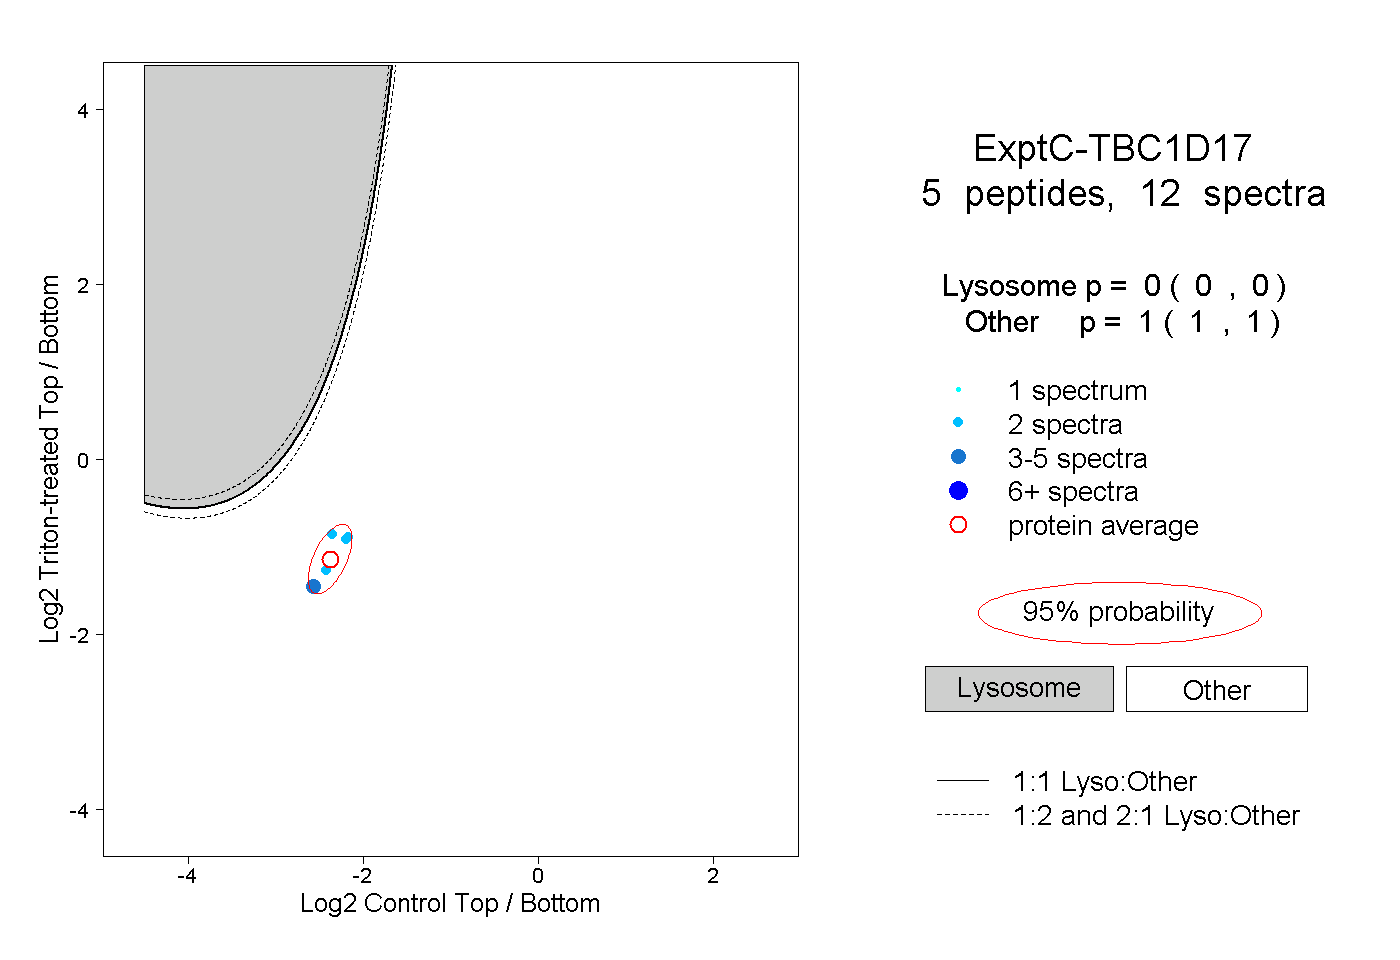 |
0.000 0.000 | 0.000 |
1.000 1.000 | 1.000 |
||||||||
| Plot | Lyso | Other | |||||||||||
| Expt D |
1 peptide |
1 spectrum |
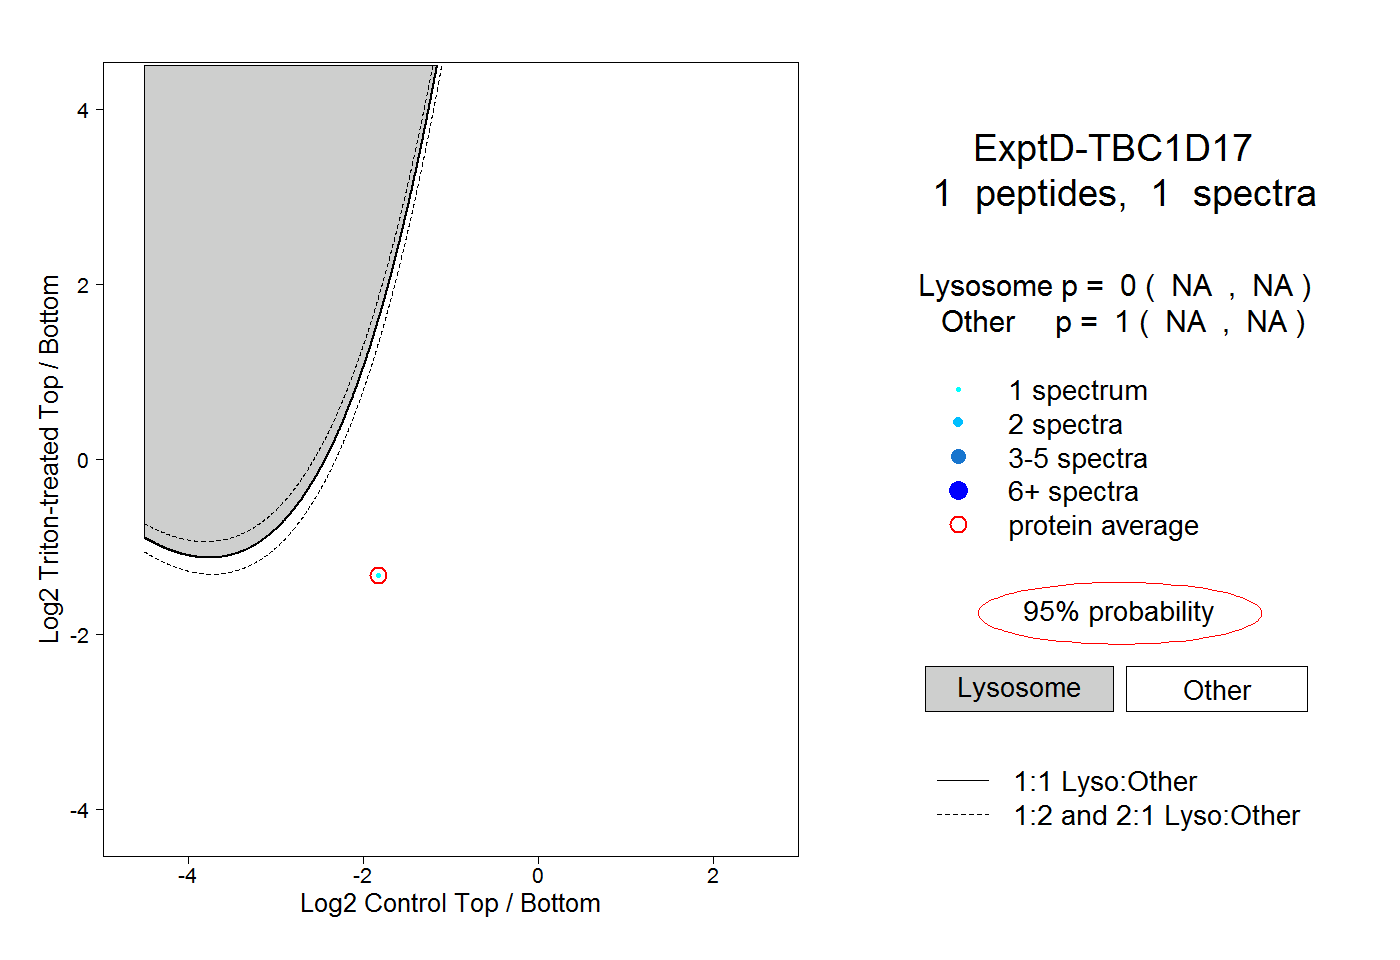 |
0.000 NA | NA |
1.000 NA | NA |