 5
5peptides
spectra
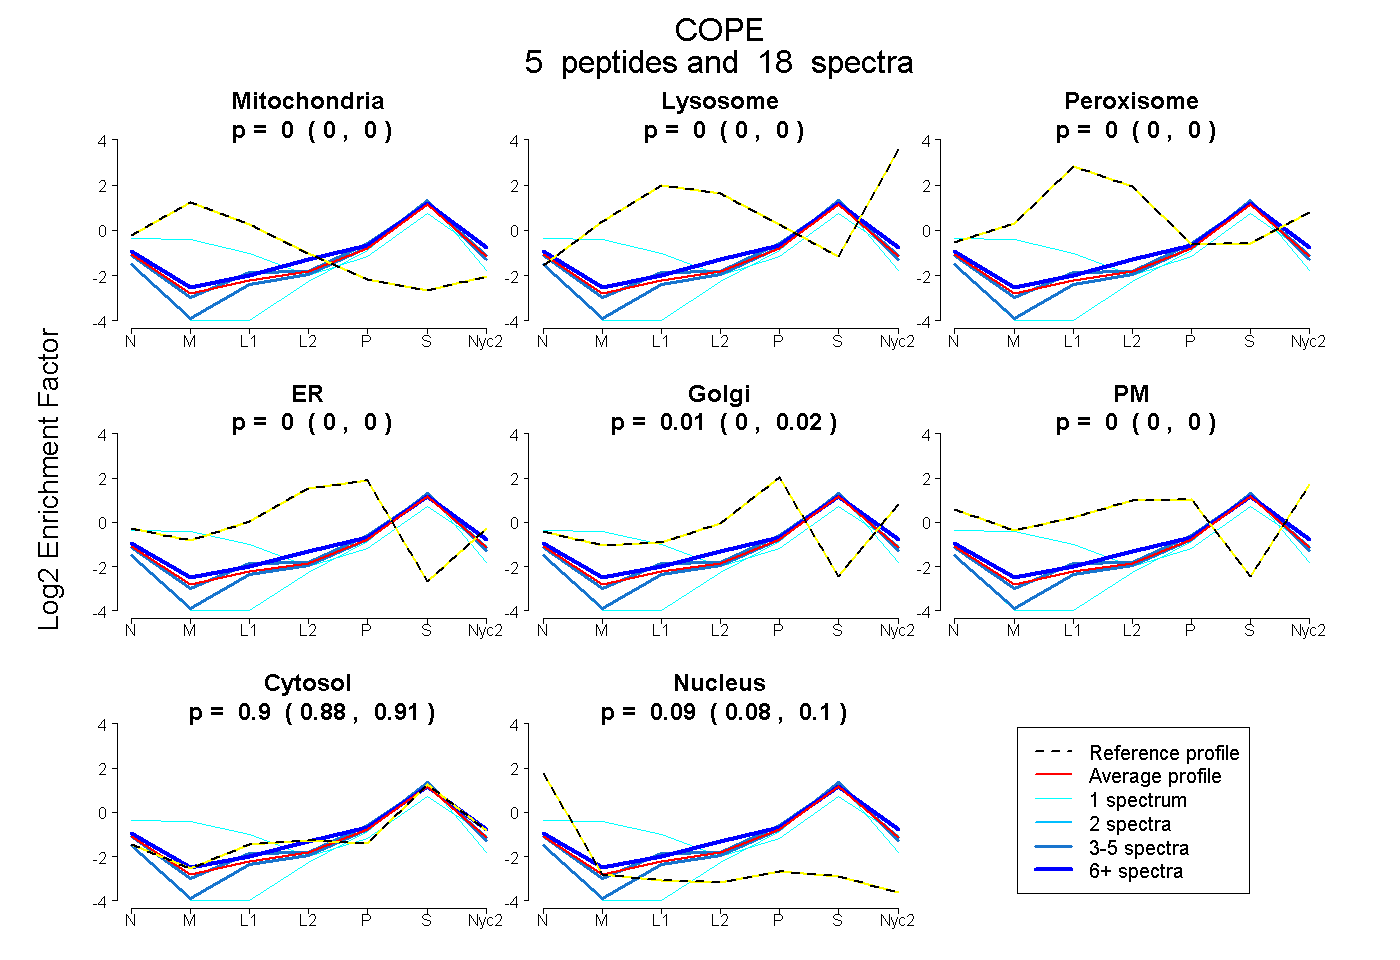
0.000 | 0.000
0.000 | 0.000
0.000 | 0.000
0.000 | 0.000
0.000 | 0.020
0.000 | 0.000
0.884 | 0.912
0.079 | 0.104
4peptides
spectra
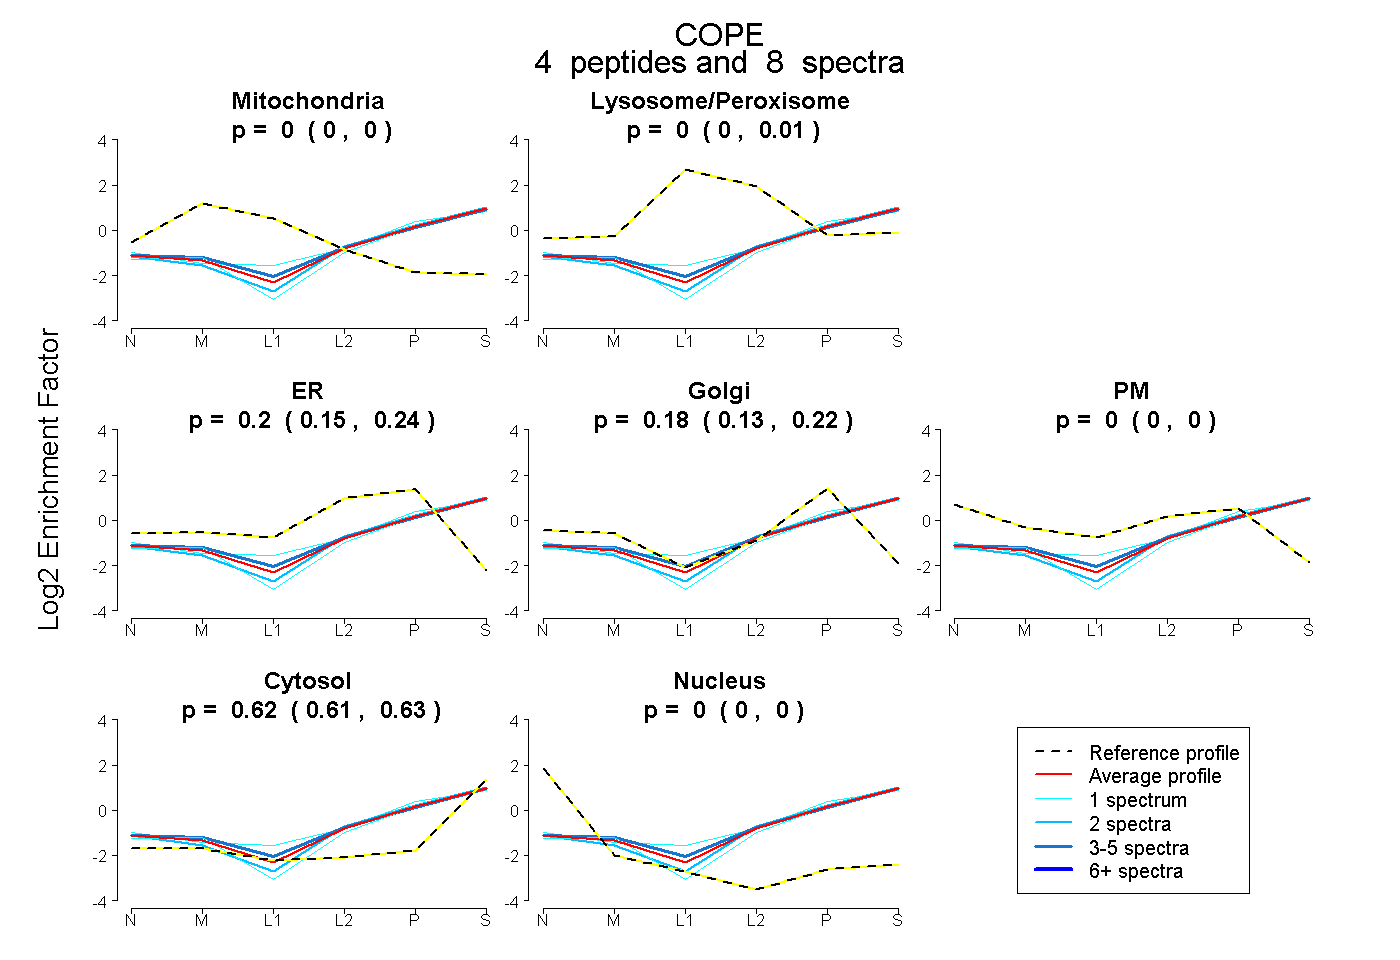
0.000 | 0.000
0.000 | 0.007
0.151 | 0.235
0.133 | 0.225
0.000 | 0.000
0.609 | 0.626
0.000 | 0.000
6peptides
spectra
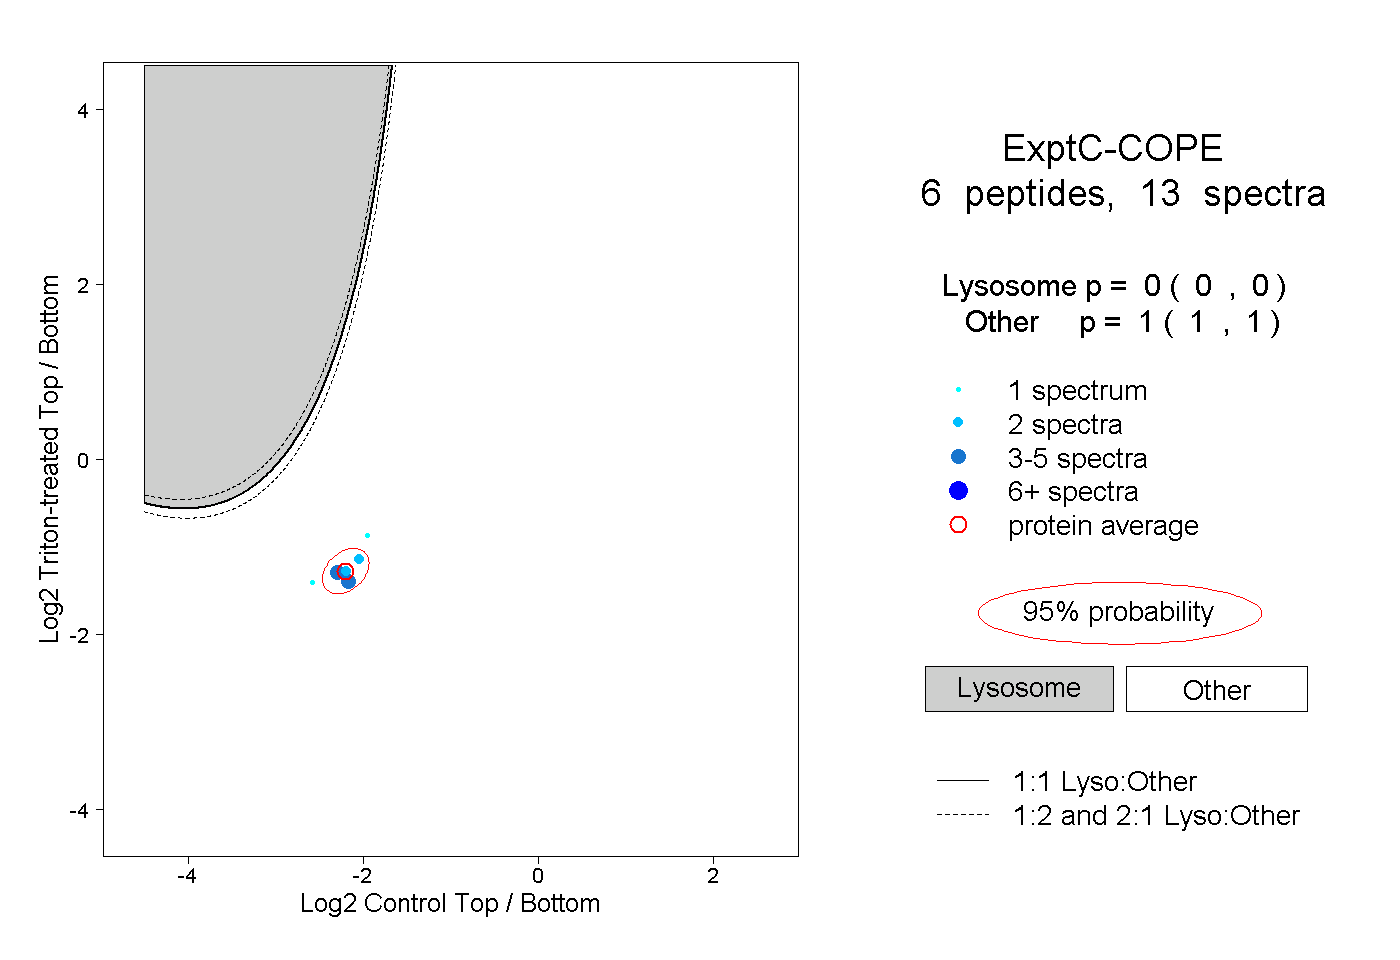
0.000 | 0.000
1.000 | 1.000
1peptide
spectra
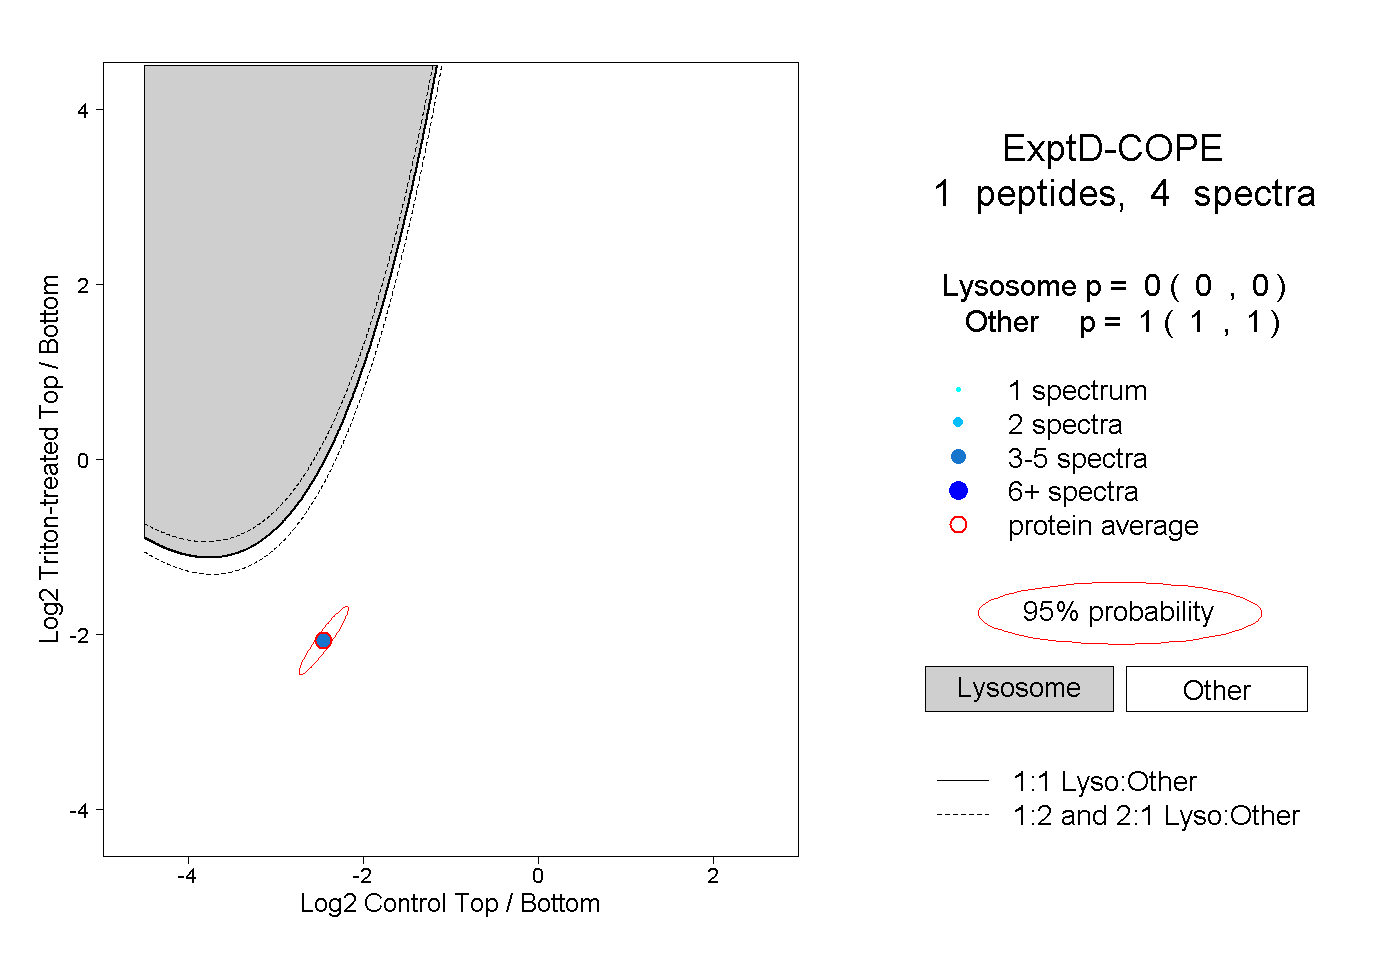
0.000 | 0.000
1.000 | 1.000