 3
3peptides
spectra
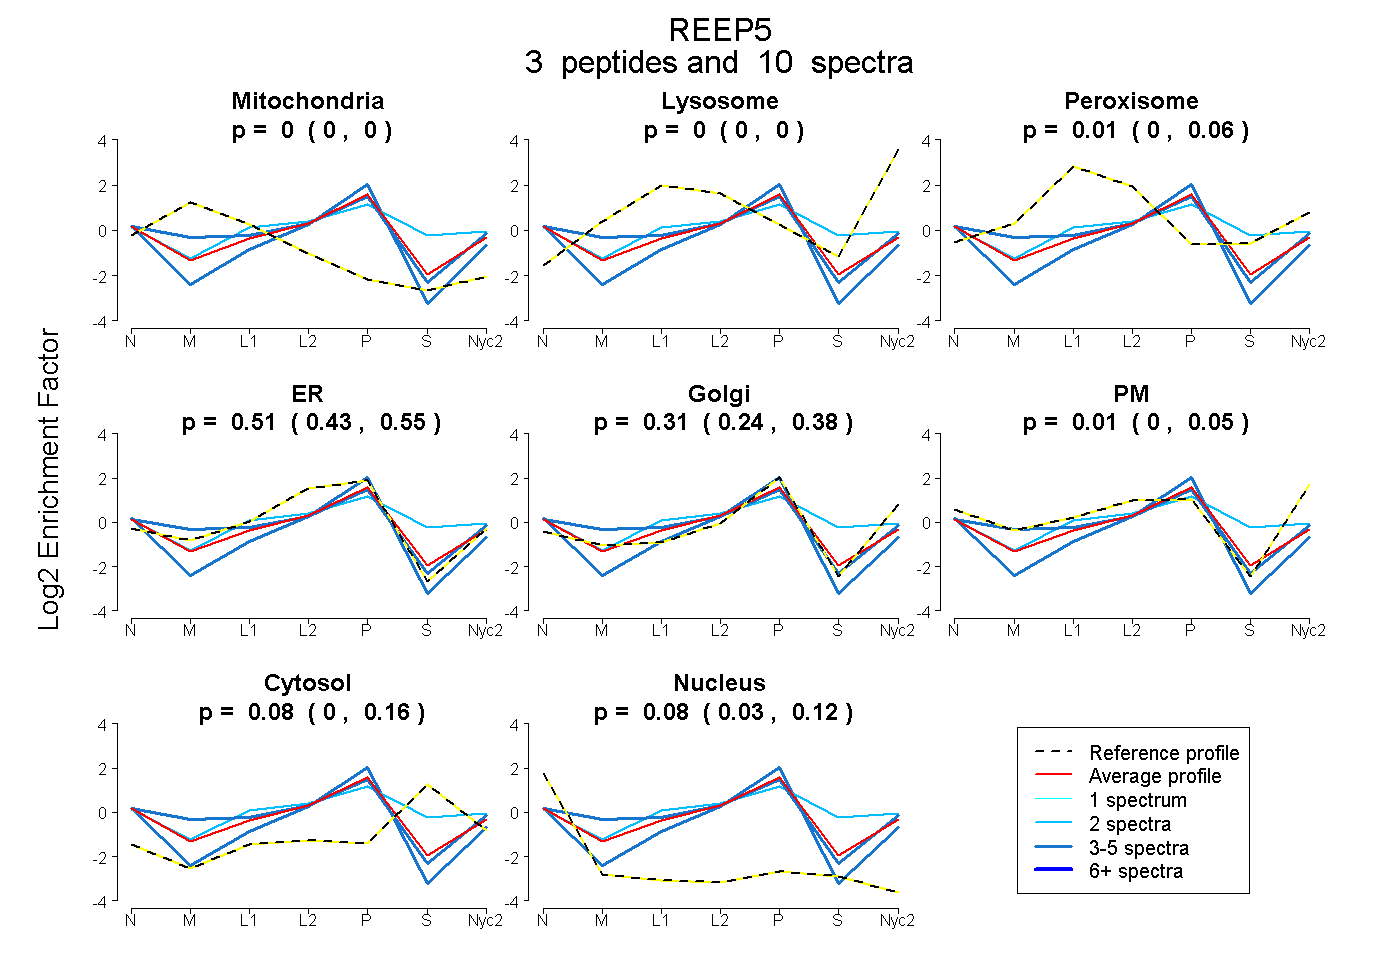
0.000 | 0.000
0.000 | 0.000
0.000 | 0.059
0.431 | 0.546
0.236 | 0.382
0.000 | 0.045
0.000 | 0.164
0.032 | 0.115
1peptide
spectra

NA | NA
NA | NA
NA | NA
NA | NA
NA | NA
NA | NA
NA | NA
5peptides
spectra
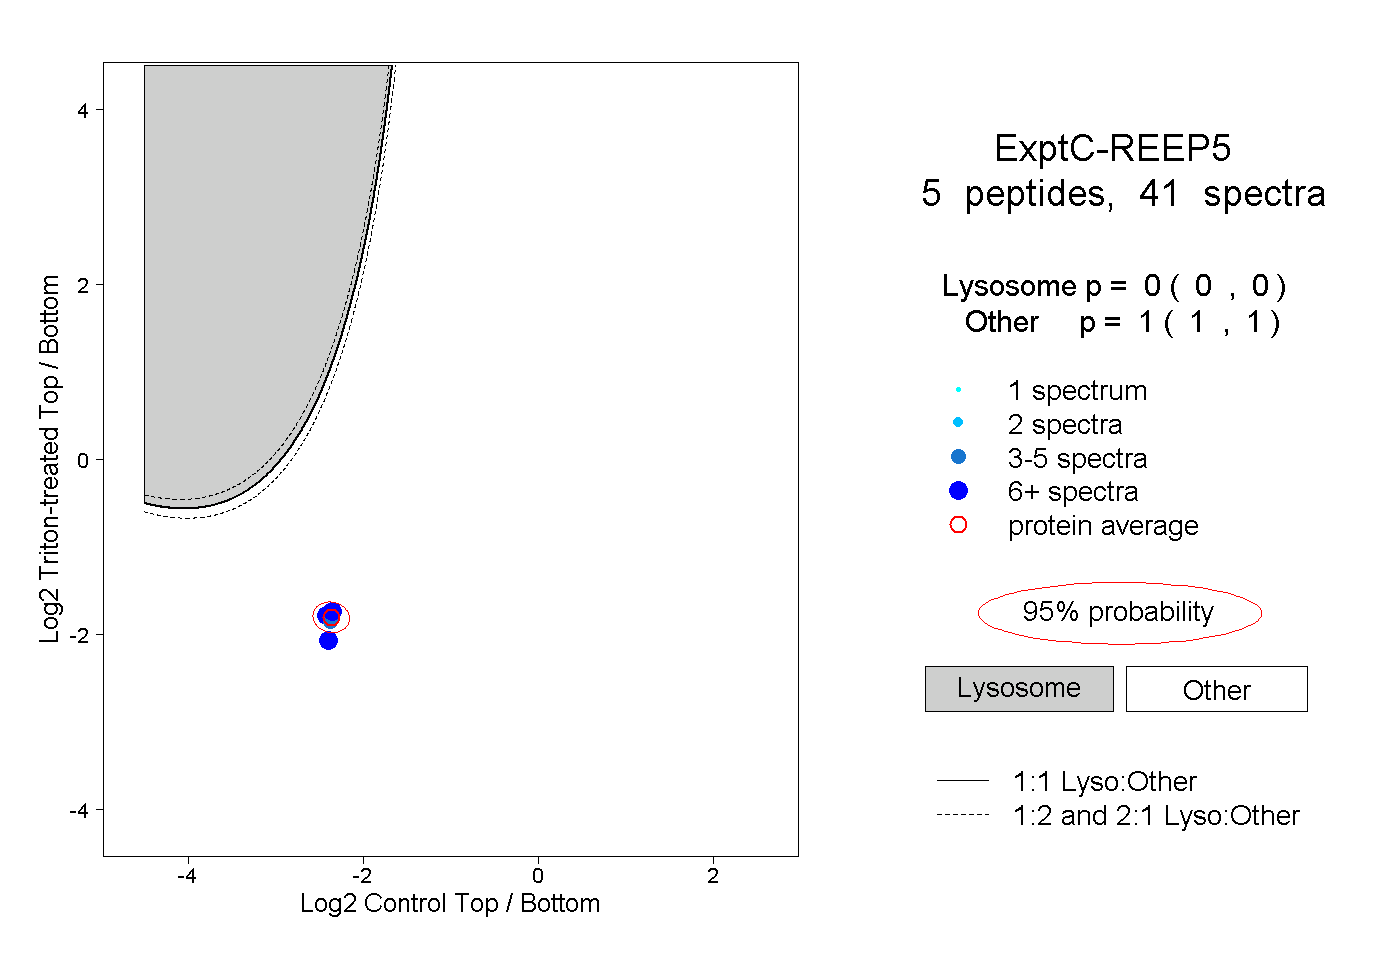
0.000 | 0.000
1.000 | 1.000
1peptide
spectrum
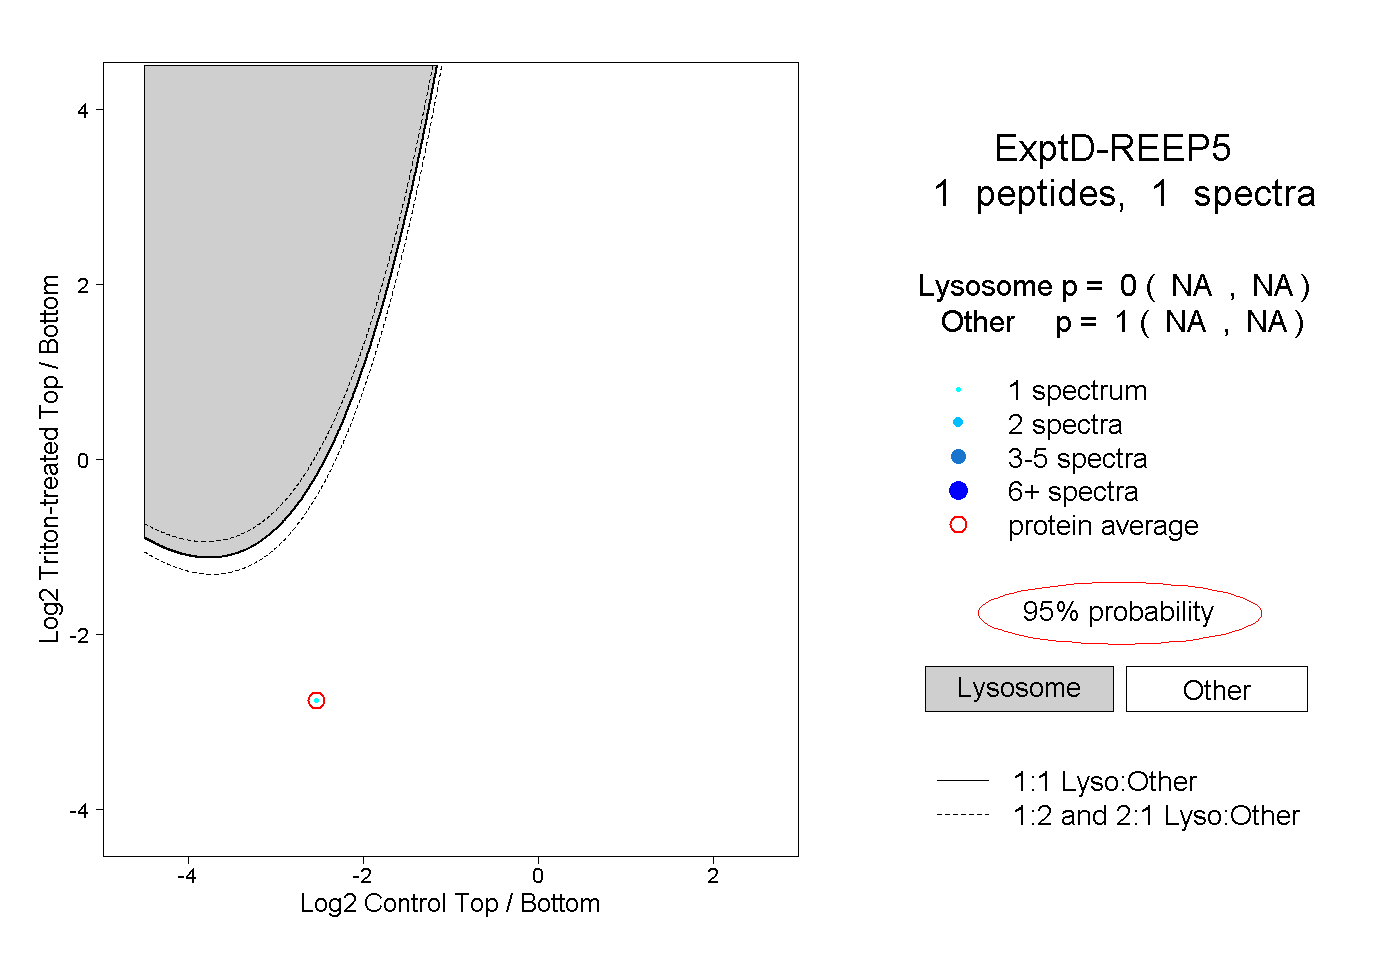
NA | NA
NA | NA