 11
11peptides
spectra

0.000 | 0.000
0.000 | 0.000
0.000 | 0.000
0.299 | 0.321
0.000 | 0.000
0.000 | 0.000
0.335 | 0.360
0.326 | 0.354
2peptides
spectra
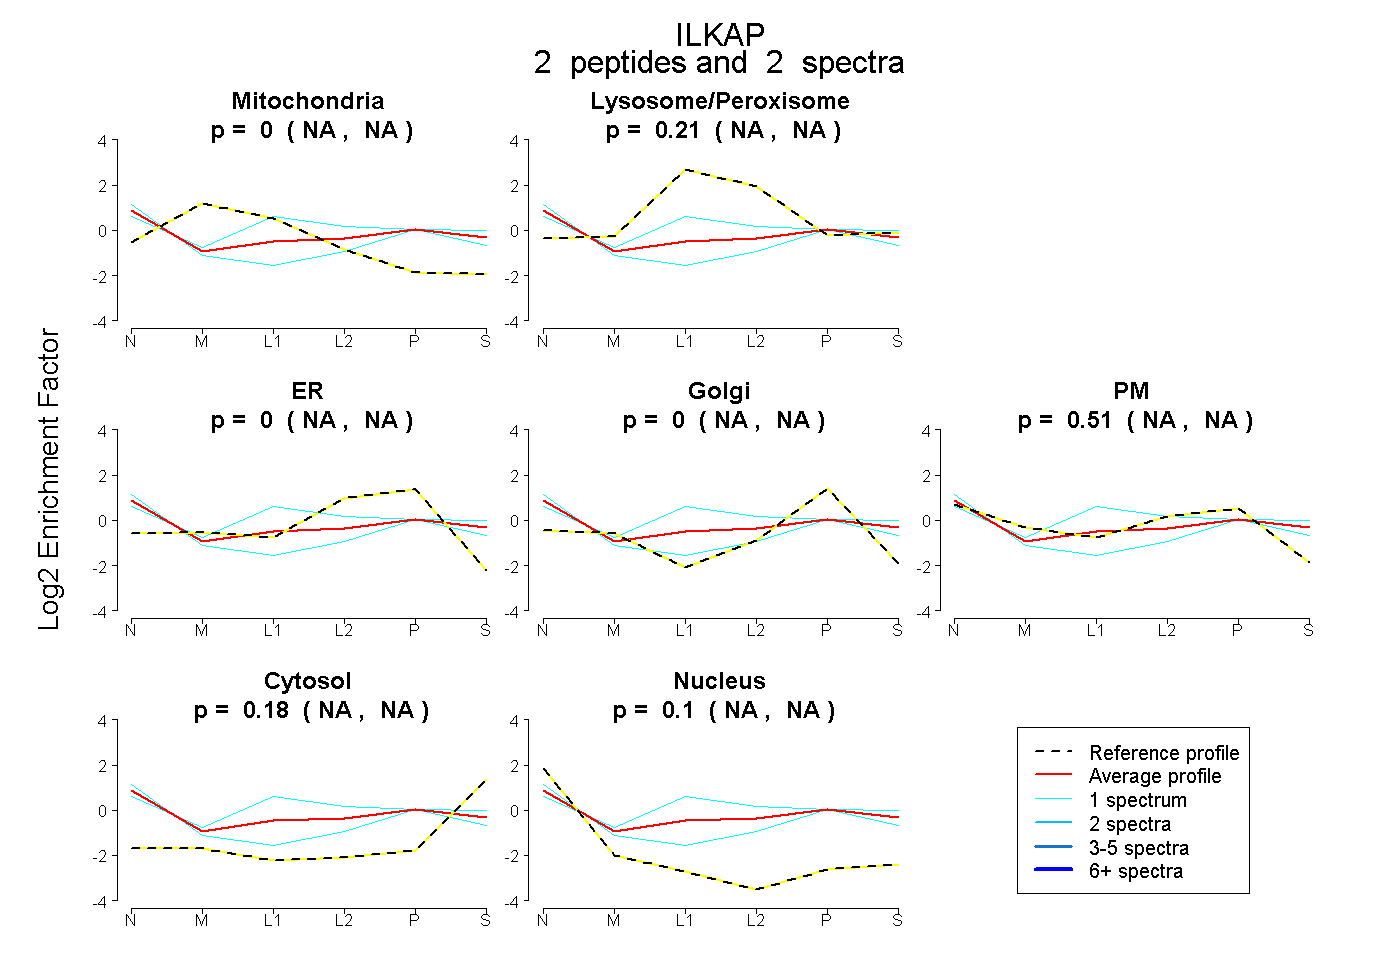
NA | NA
NA | NA
NA | NA
NA | NA
NA | NA
NA | NA
NA | NA
1peptide
spectrum

NA | NA
NA | NA
1peptide
spectrum
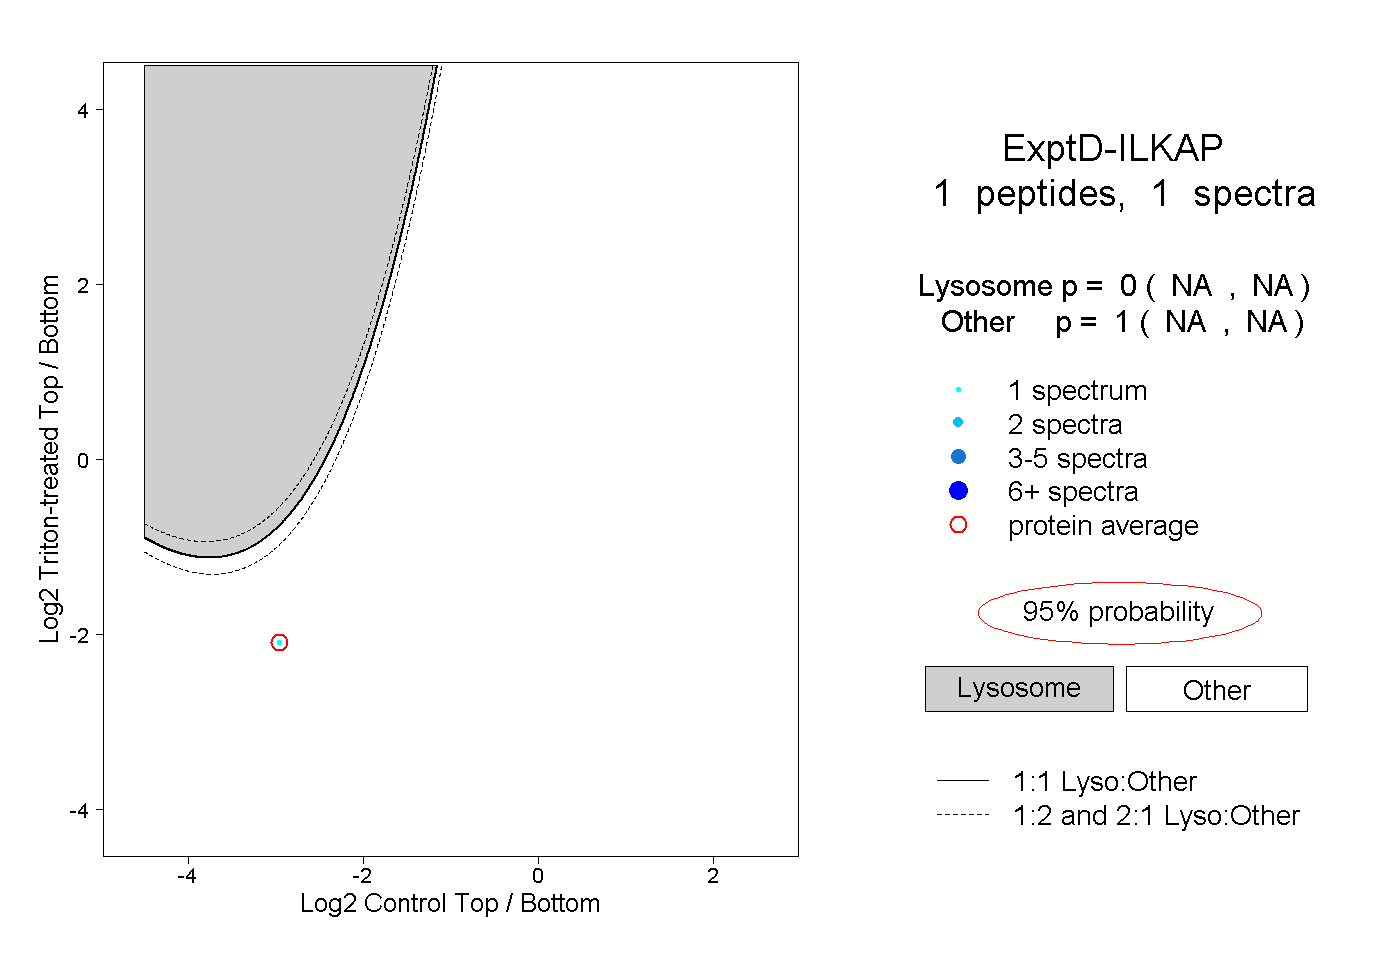
NA | NA
NA | NA