 20
20peptides
spectra
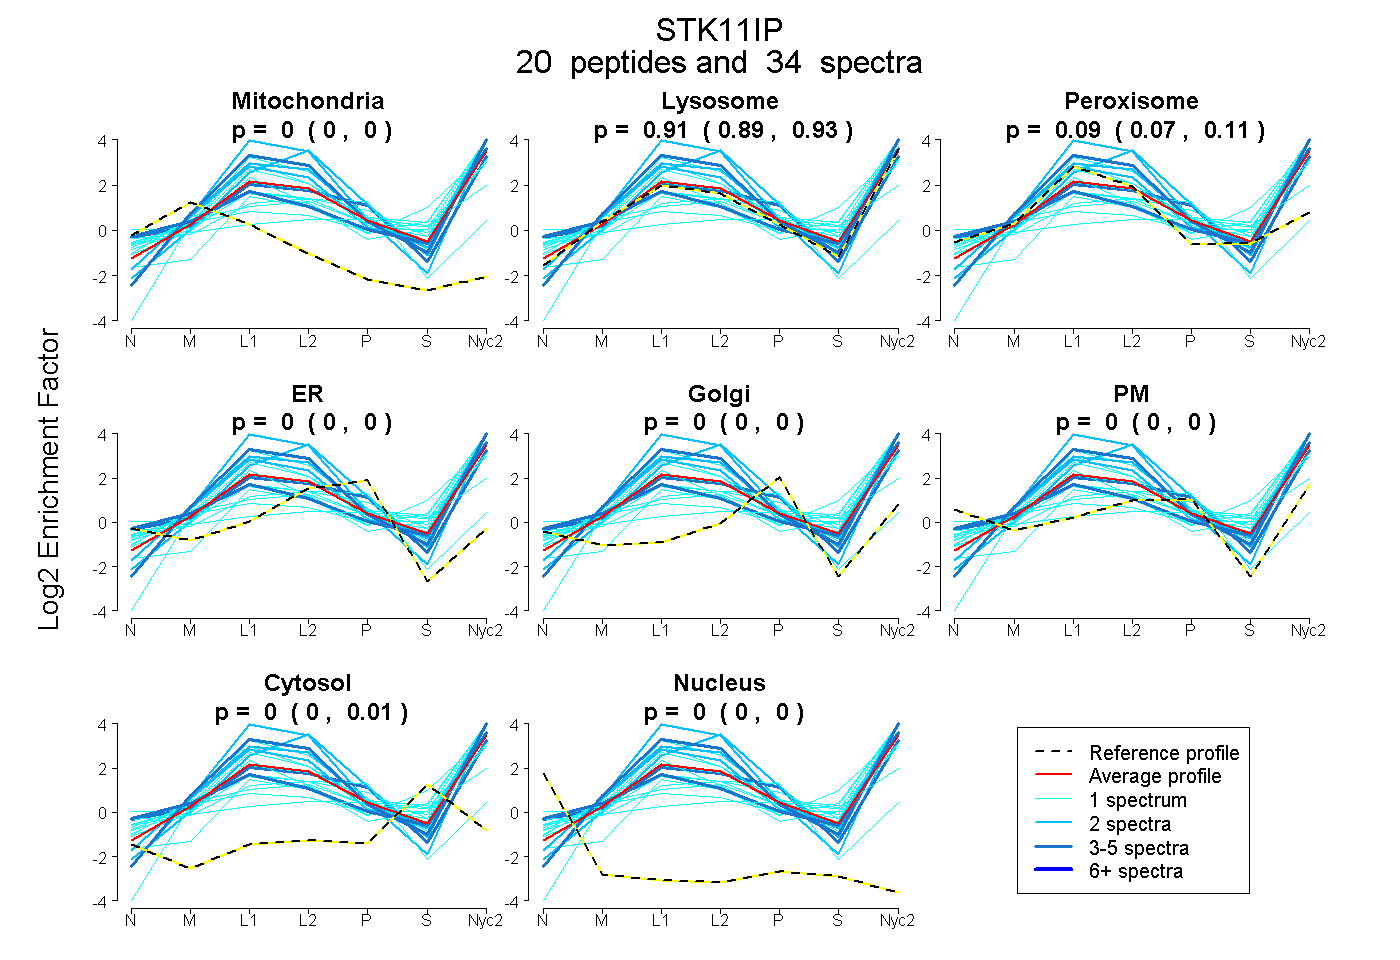
0.000 | 0.000
0.891 | 0.929
0.065 | 0.106
0.000 | 0.000
0.000 | 0.000
0.000 | 0.000
0.000 | 0.006
0.000 | 0.000
6peptides
spectra
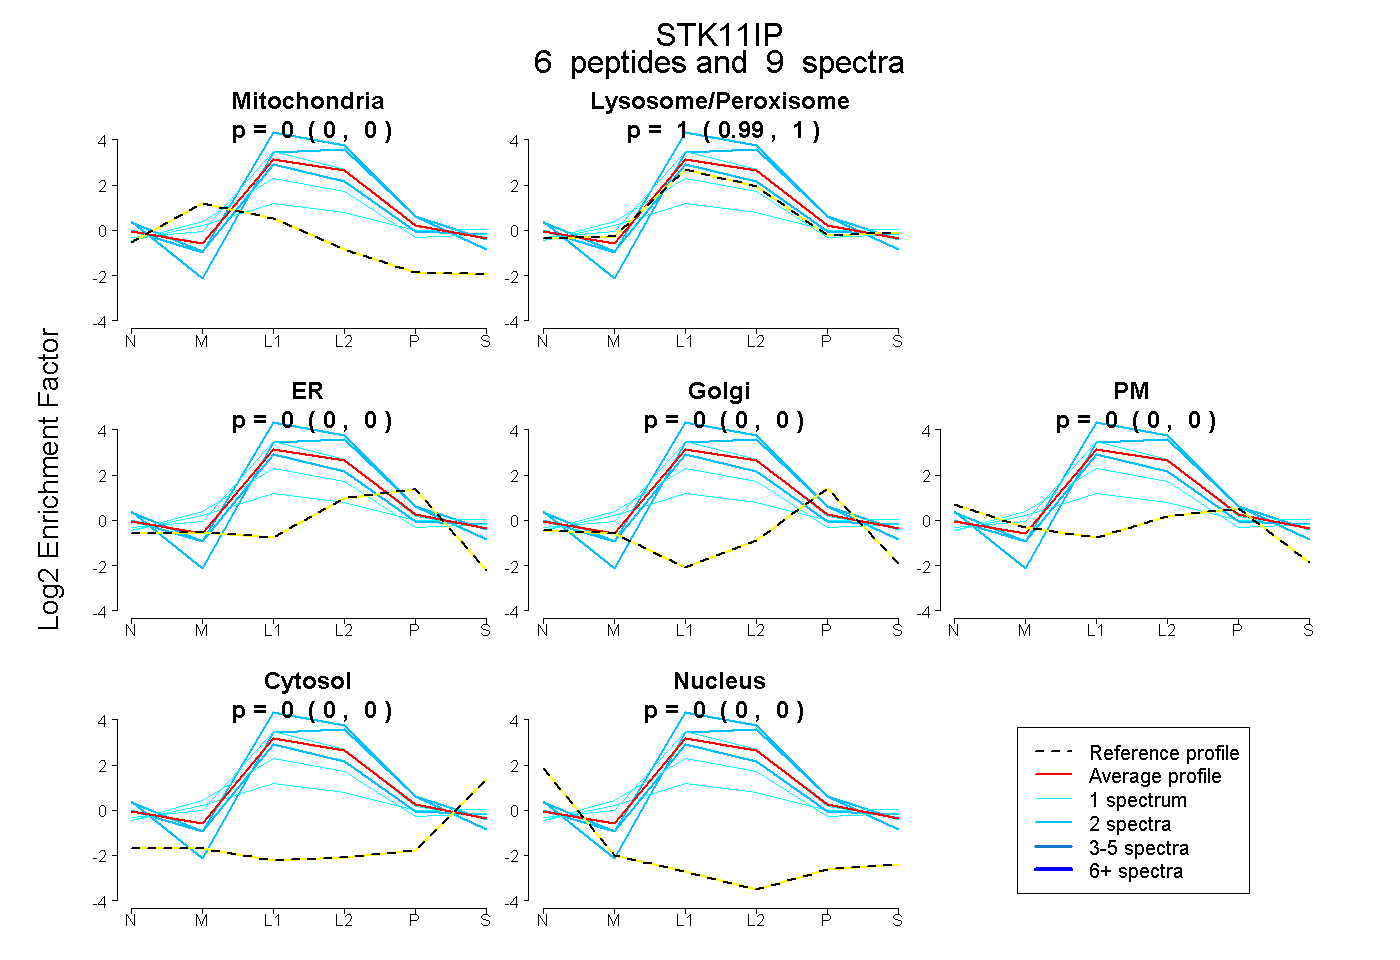
0.000 | 0.000
0.994 | 1.000
0.000 | 0.000
0.000 | 0.000
0.000 | 0.000
0.000 | 0.000
0.000 | 0.000
23peptides
spectra
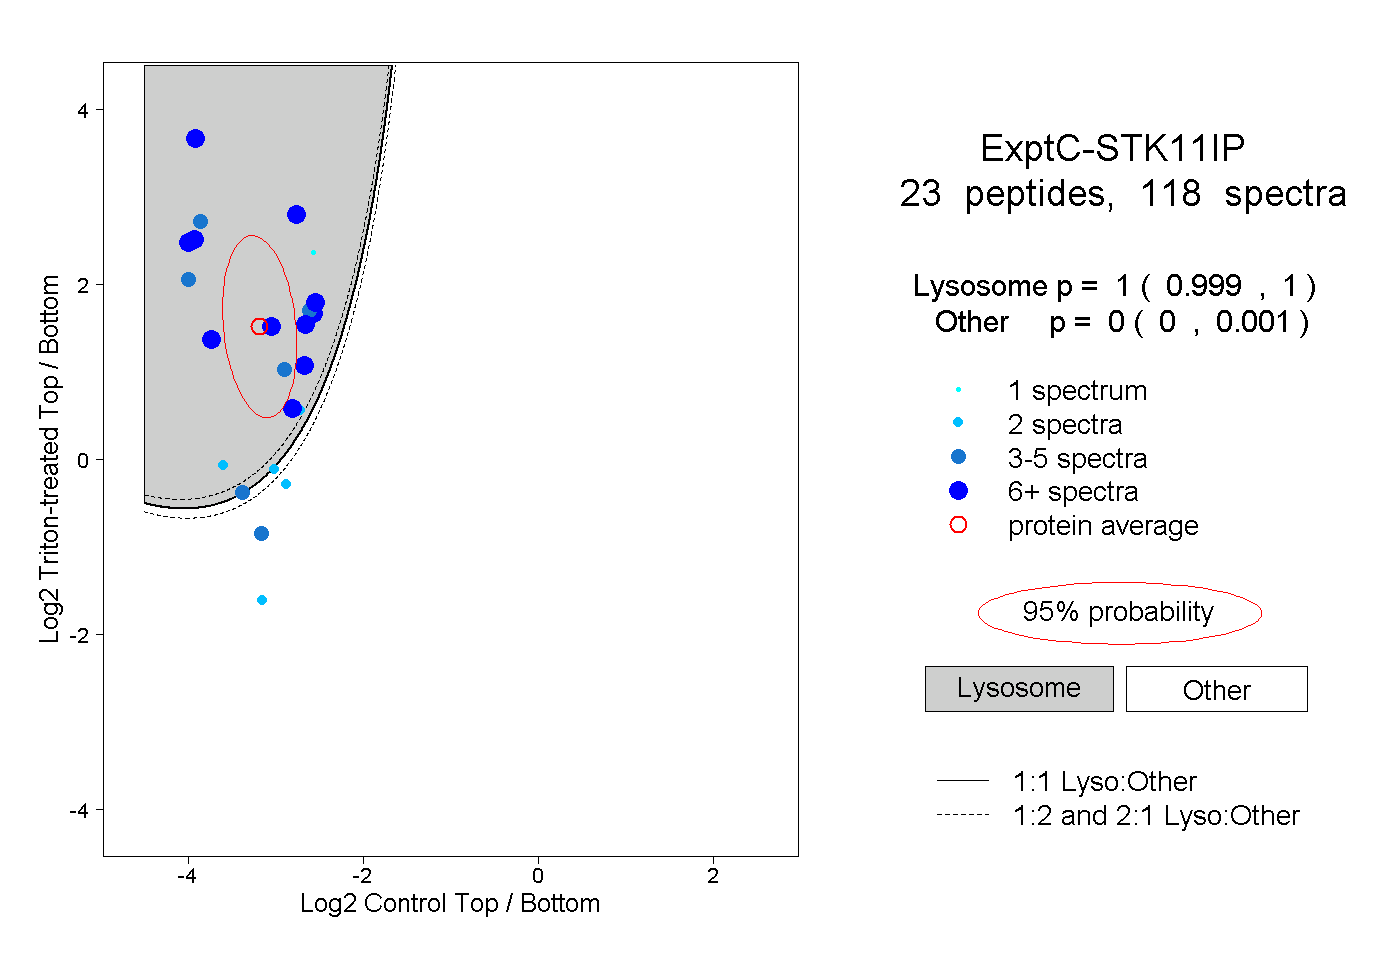
0.999 | 1.000
0.000 | 0.001
4peptides
spectra
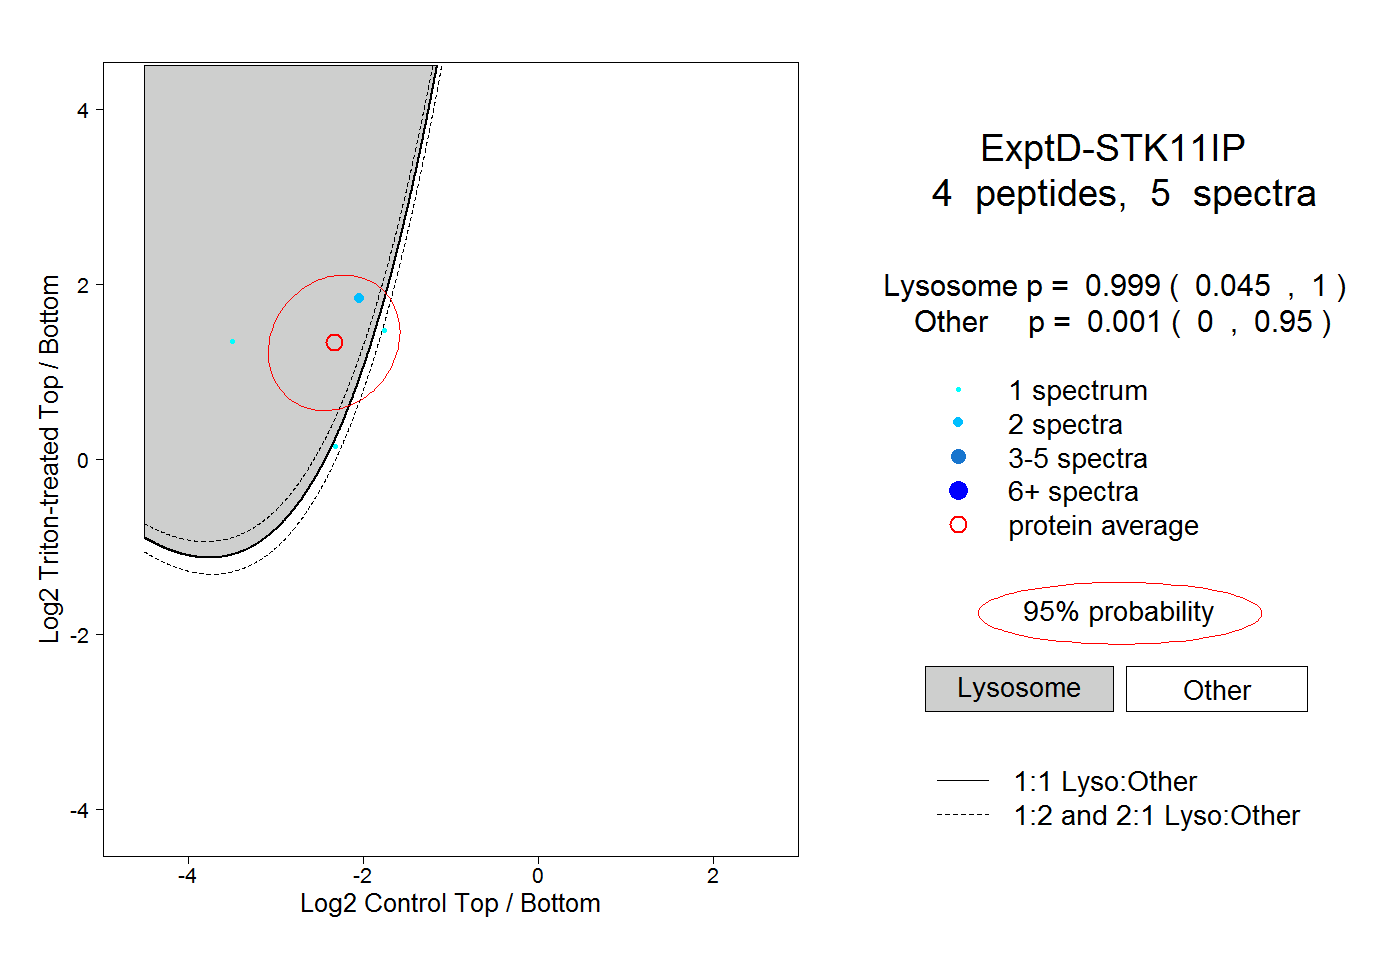
0.045 | 1.000
0.000 | 0.950