 20
20peptides
spectra
0.000 | 0.000
0.891 | 0.929
0.065 | 0.106
0.000 | 0.000
0.000 | 0.000
0.000 | 0.000
0.000 | 0.006
0.000 | 0.000
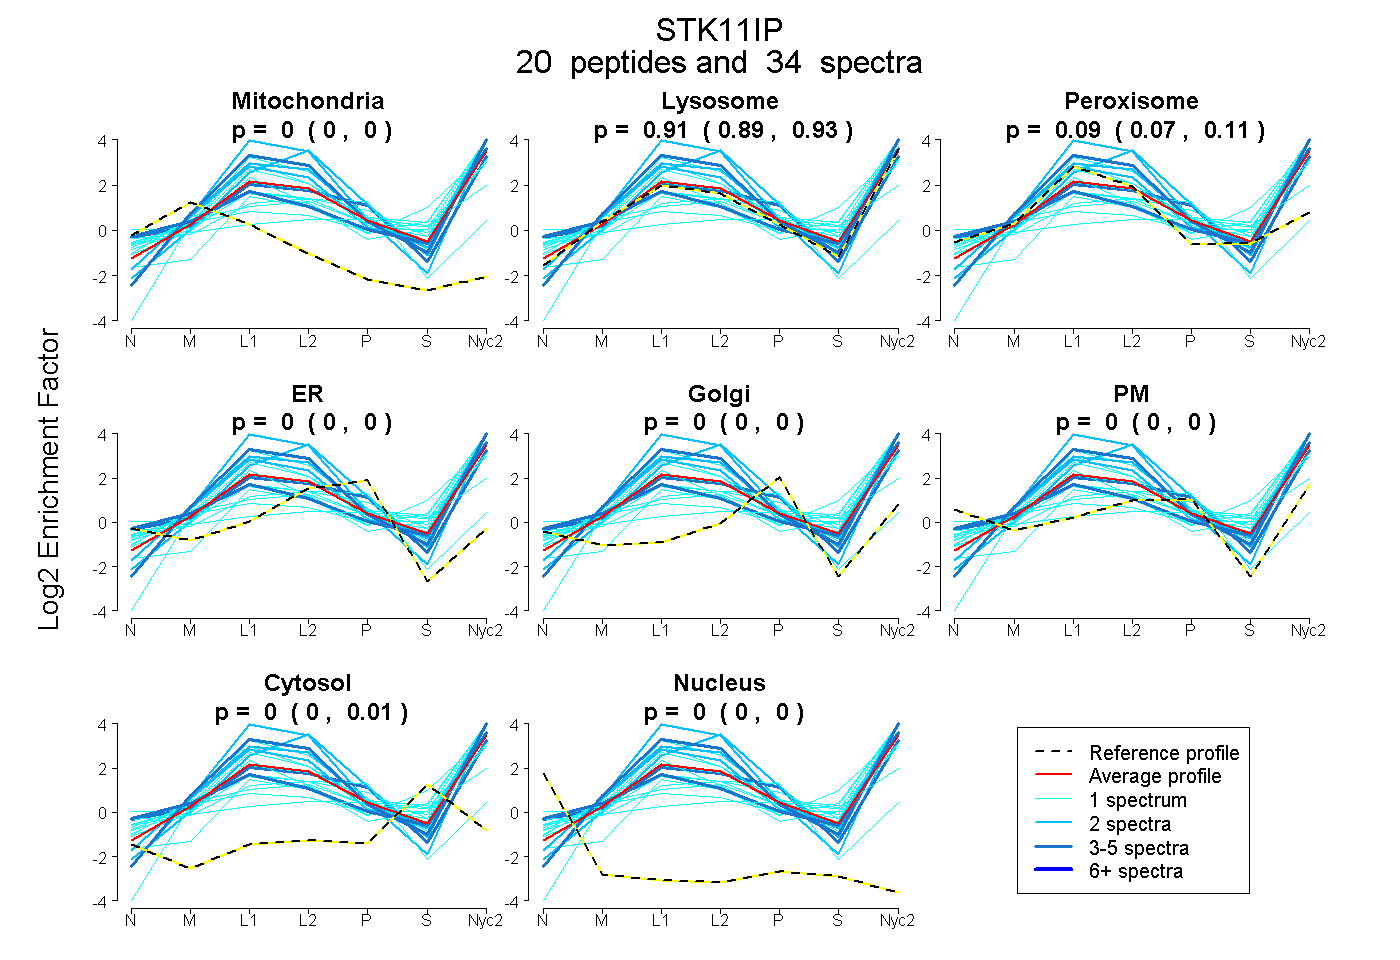
| Plot | Mito | Lyso | Perox | ER | Golgi | PM | Cytosol | Nucleus | |||||
| Expt A |
20 peptides |
34 spectra |
|
0.000 0.000 | 0.000 |
0.912 0.891 | 0.929 |
0.088 0.065 | 0.106 |
0.000 0.000 | 0.000 |
0.000 0.000 | 0.000 |
0.000 0.000 | 0.000 |
0.000 0.000 | 0.006 |
0.000 0.000 | 0.000 |
| 1 spectrum, MLYLLK | 0.000 | 0.934 | 0.000 | 0.000 | 0.000 | 0.000 | 0.066 | 0.000 | ||
| 1 spectrum, LEWAAGTGHCVLLPR | 0.000 | 0.781 | 0.102 | 0.000 | 0.000 | 0.000 | 0.116 | 0.000 | ||
| 1 spectrum, DAAHGFLLDGK | 0.000 | 0.927 | 0.073 | 0.000 | 0.000 | 0.000 | 0.000 | 0.000 | ||
| 1 spectrum, NCISATEETVTPQHR | 0.000 | 0.676 | 0.000 | 0.000 | 0.000 | 0.238 | 0.086 | 0.000 | ||
| 1 spectrum, DTSAETPQFFYLR | 0.000 | 0.925 | 0.075 | 0.000 | 0.000 | 0.000 | 0.000 | 0.000 | ||
| 5 spectra, VPVVLAGHTR | 0.000 | 0.807 | 0.027 | 0.000 | 0.000 | 0.131 | 0.034 | 0.000 | ||
| 5 spectra, GVPIHSLCGLR | 0.000 | 0.711 | 0.007 | 0.000 | 0.000 | 0.282 | 0.000 | 0.000 | ||
| 2 spectra, LESFWALR | 0.000 | 1.000 | 0.000 | 0.000 | 0.000 | 0.000 | 0.000 | 0.000 | ||
| 1 spectrum, VTSAHLFEVGLQAAQTLER | 0.000 | 0.481 | 0.000 | 0.000 | 0.000 | 0.206 | 0.313 | 0.000 | ||
| 2 spectra, LIFYDEVSR | 0.000 | 1.000 | 0.000 | 0.000 | 0.000 | 0.000 | 0.000 | 0.000 | ||
| 1 spectrum, LWPLLGK | 0.000 | 0.887 | 0.000 | 0.000 | 0.000 | 0.000 | 0.113 | 0.000 | ||
| 1 spectrum, TTAPR | 0.000 | 0.000 | 0.370 | 0.432 | 0.000 | 0.198 | 0.000 | 0.000 | ||
| 1 spectrum, TSPLDLR | 0.000 | 0.898 | 0.102 | 0.000 | 0.000 | 0.000 | 0.000 | 0.000 | ||
| 3 spectra, TVTQEALDLDR | 0.000 | 1.000 | 0.000 | 0.000 | 0.000 | 0.000 | 0.000 | 0.000 | ||
| 1 spectrum, LVHTPGVGLPGPIK | 0.000 | 0.734 | 0.000 | 0.000 | 0.000 | 0.056 | 0.210 | 0.000 | ||
| 1 spectrum, SLQGLEQLK | 0.000 | 0.995 | 0.000 | 0.000 | 0.000 | 0.000 | 0.005 | 0.000 | ||
| 1 spectrum, ILSAIR | 0.000 | 0.925 | 0.000 | 0.000 | 0.000 | 0.000 | 0.075 | 0.000 | ||
| 2 spectra, ATTAQYLSPR | 0.000 | 1.000 | 0.000 | 0.000 | 0.000 | 0.000 | 0.000 | 0.000 | ||
| 2 spectra, LAGLLR | 0.000 | 1.000 | 0.000 | 0.000 | 0.000 | 0.000 | 0.000 | 0.000 | ||
| 1 spectrum, EPWEELFSIGLR | 0.000 | 0.740 | 0.000 | 0.000 | 0.000 | 0.000 | 0.260 | 0.000 |
| Plot | Mito | Lyso or Perox | ER | Golgi | PM | Cytosol | Nucleus | ||||||
| Expt B |
6 peptides |
9 spectra |
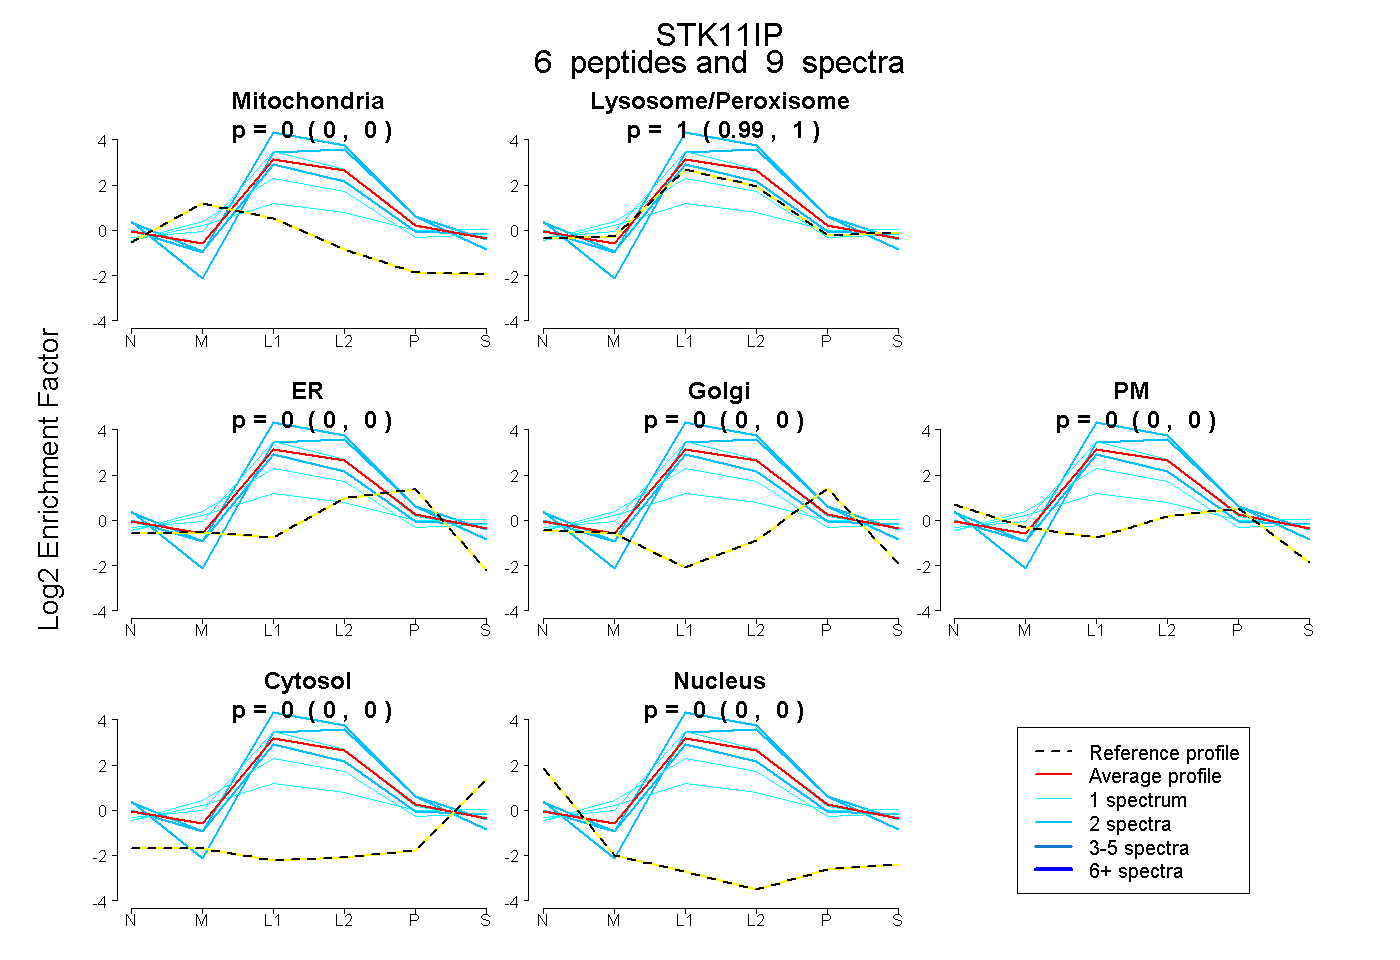 |
0.000 0.000 | 0.000 |
1.000 0.994 | 1.000 |
0.000 0.000 | 0.000 |
0.000 0.000 | 0.000 |
0.000 0.000 | 0.000 |
0.000 0.000 | 0.000 |
0.000 0.000 | 0.000 |
|||
| Plot | Lyso | Other | |||||||||||
| Expt C |
23 peptides |
118 spectra |
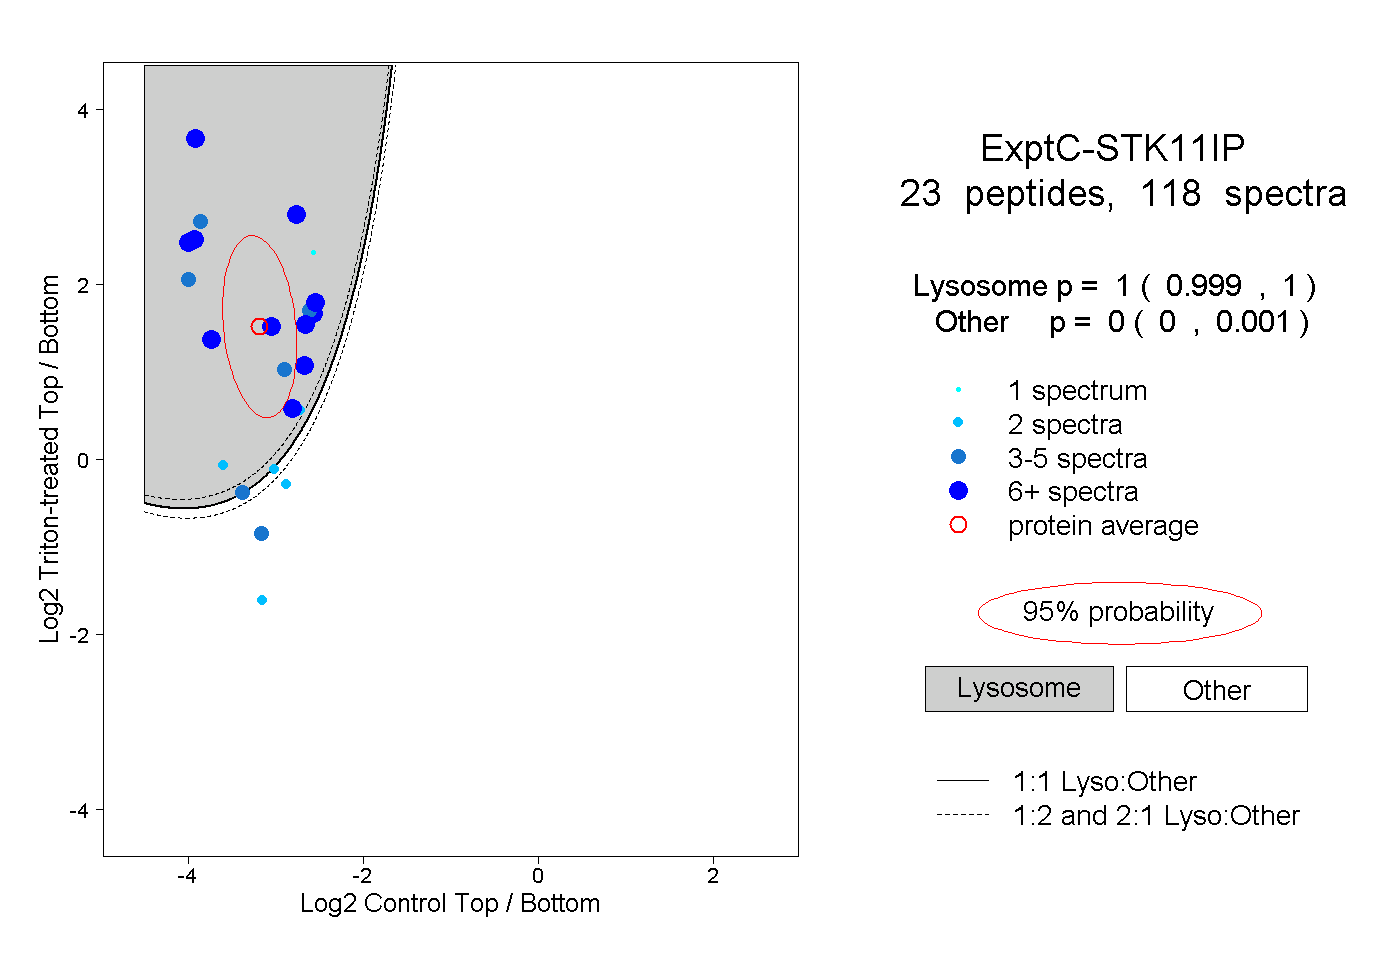 |
1.000 0.999 | 1.000 |
0.000 0.000 | 0.001 |
||||||||
| Plot | Lyso | Other | |||||||||||
| Expt D |
4 peptides |
5 spectra |
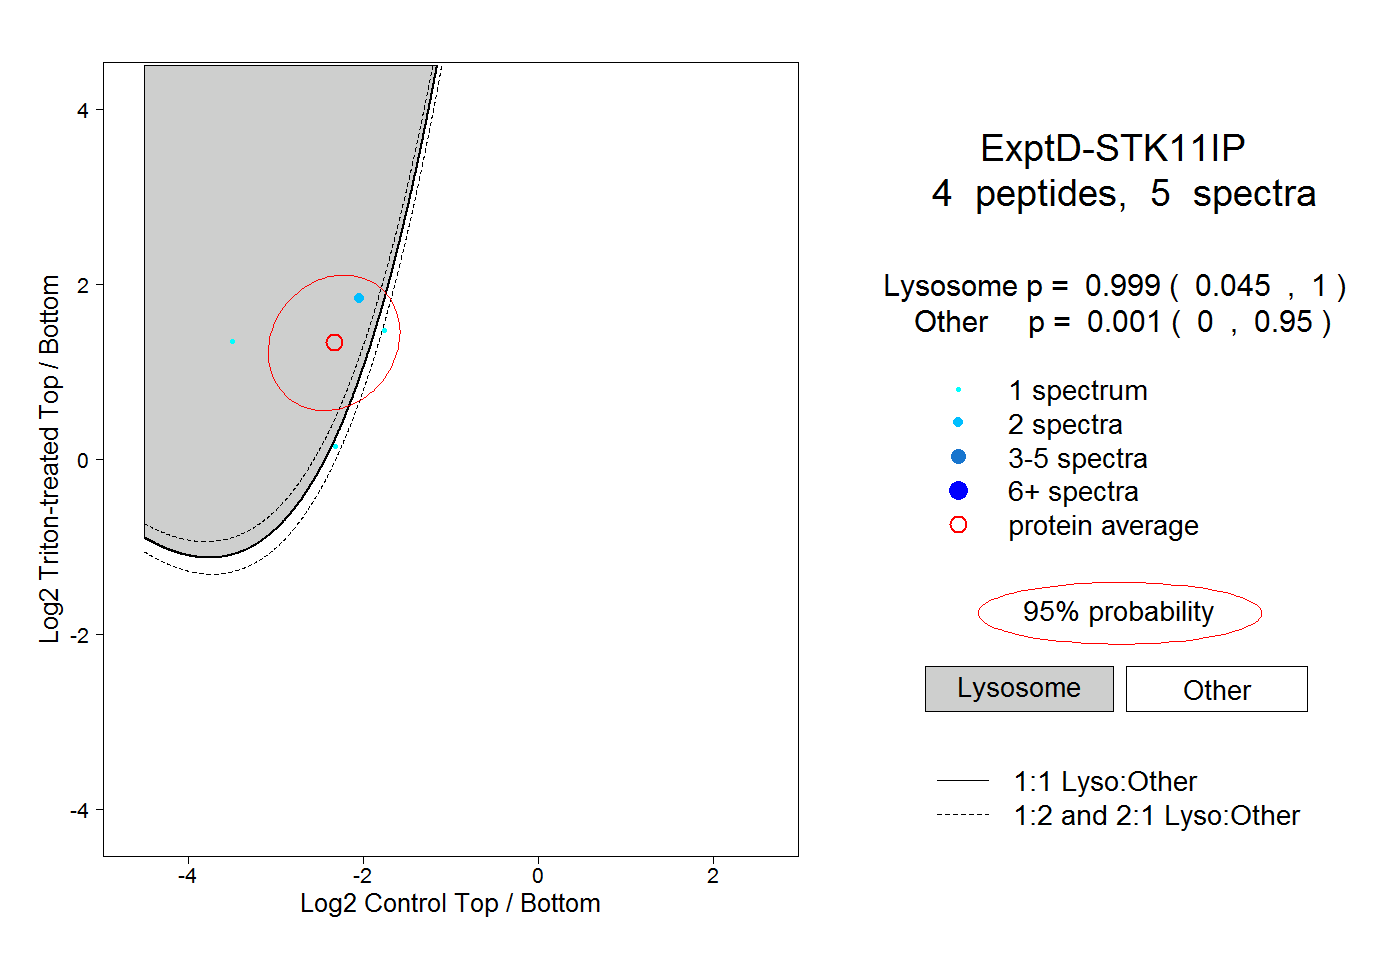 |
0.999 0.045 | 1.000 |
0.001 0.000 | 0.950 |