SDF4
[ENSRNOP00000027215]
Main page
| | | Plot |
Mito |
Lyso |
|
Perox |
ER |
Golgi |
PM |
Cytosol |
Nucleus |
|
| Expt A |
 7
7
peptides |
14
spectra |
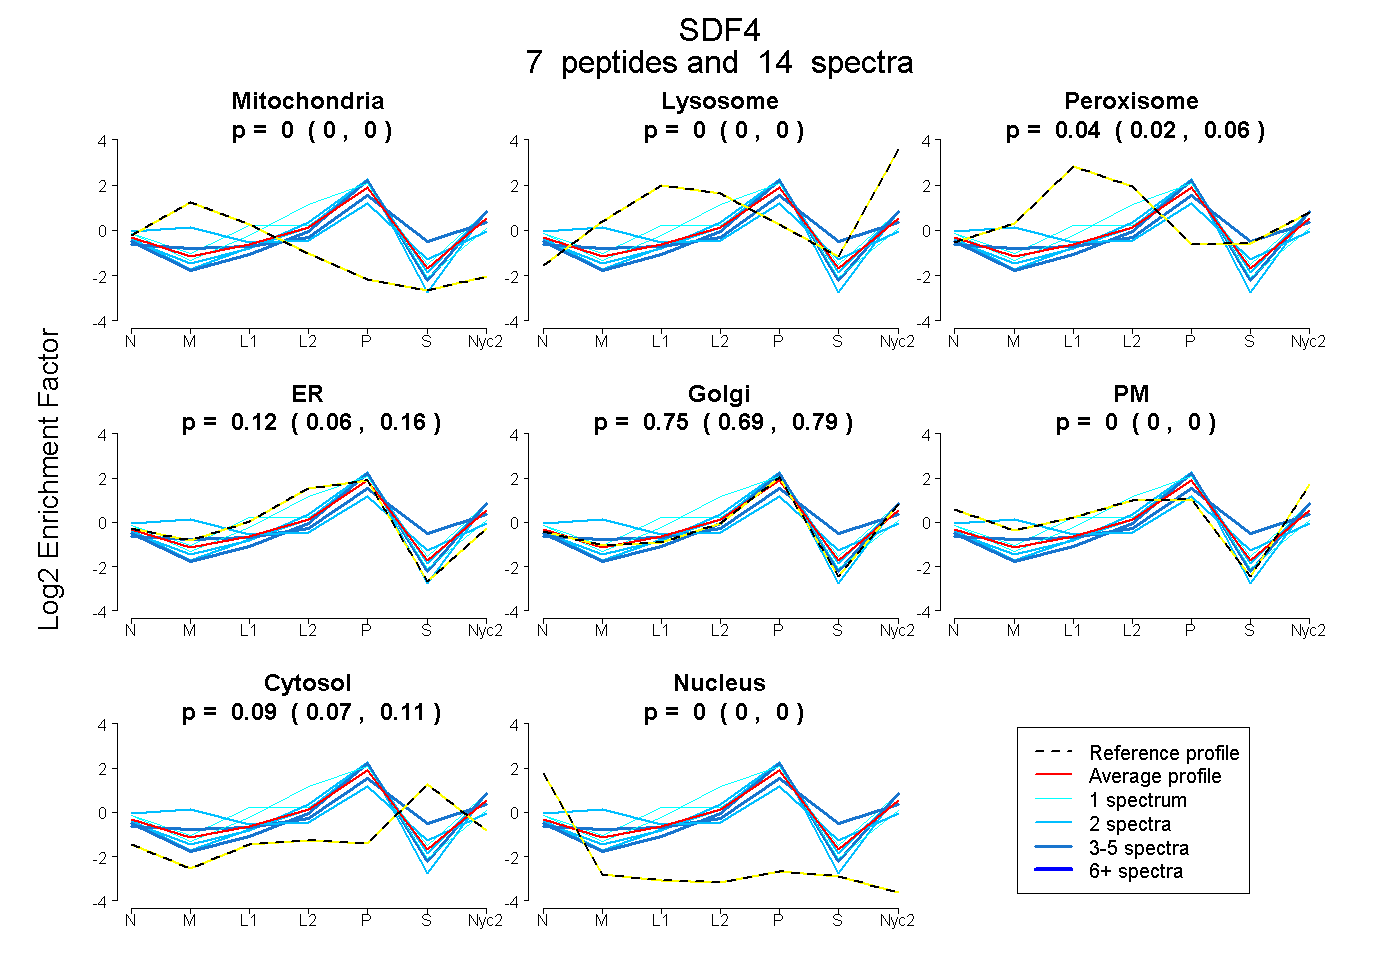 |
0.000
0.000 | 0.000 |
0.000
0.000 | 0.000 |
|
0.040
0.017 | 0.060 |
0.118
0.062 | 0.165 |
0.748
0.691 | 0.787 |
0.000
0.000 | 0.000 |
0.094
0.071 | 0.114 |
0.000
0.000 | 0.000 |
|
| | | Plot |
Mito |
|
Lyso or Perox |
|
ER |
Golgi |
PM |
Cytosol |
Nucleus |
|
| Expt B |
3
peptides |
3
spectra |
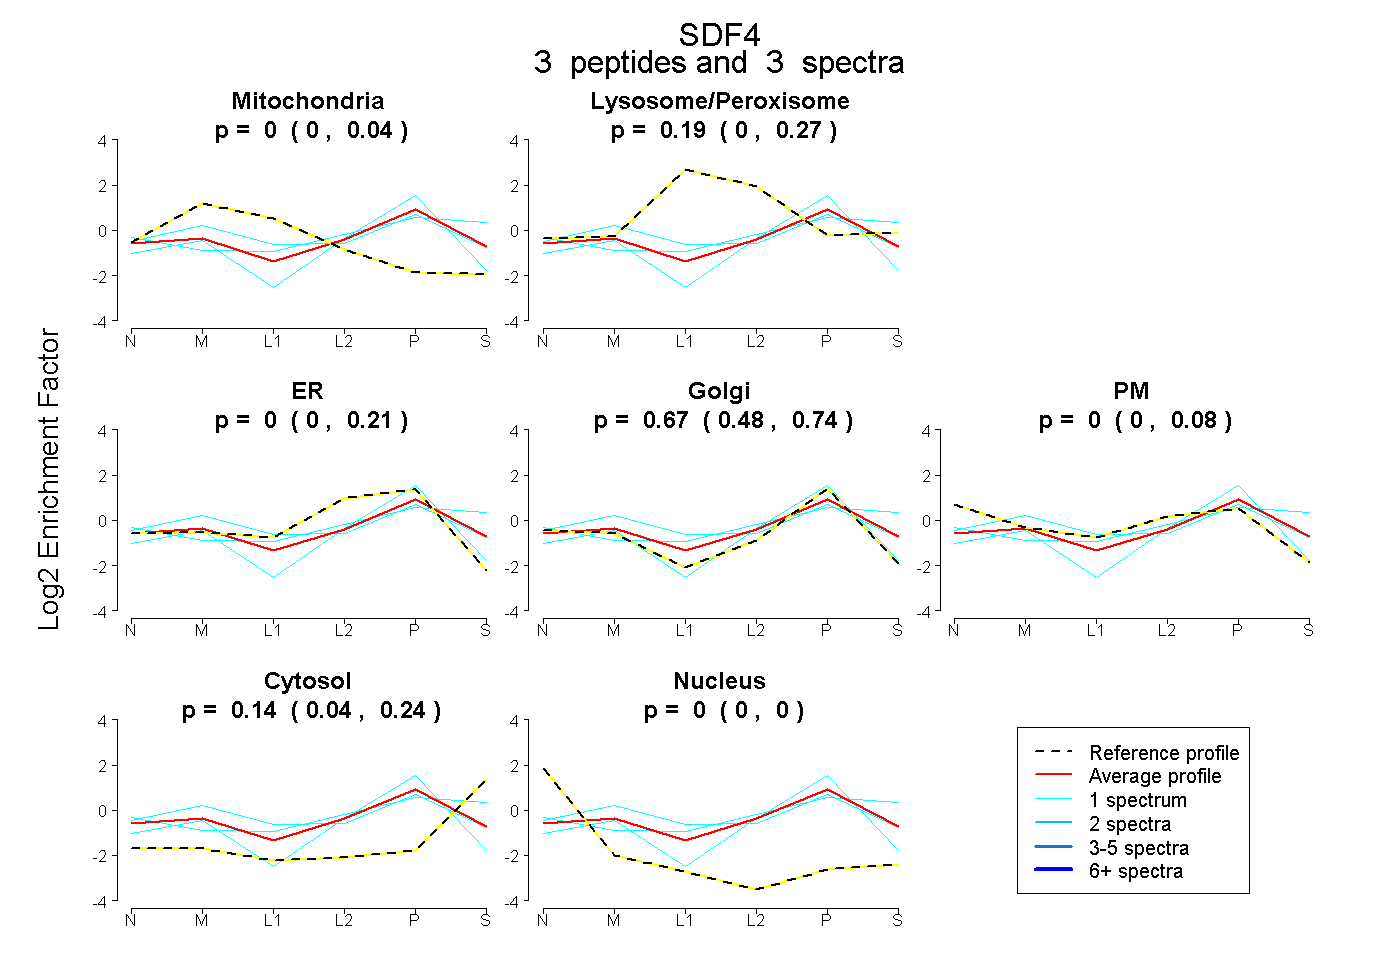 |
0.000
0.000 | 0.044 |
|
0.189
0.000 | 0.265 |
|
0.000
0.000 | 0.210 |
0.674
0.482 | 0.739 |
0.000
0.000 | 0.078 |
0.136
0.035 | 0.238 |
0.000
0.000 | 0.000 |
|
| | | Plot |
|
Lyso |
|
|
|
|
|
|
|
Other |
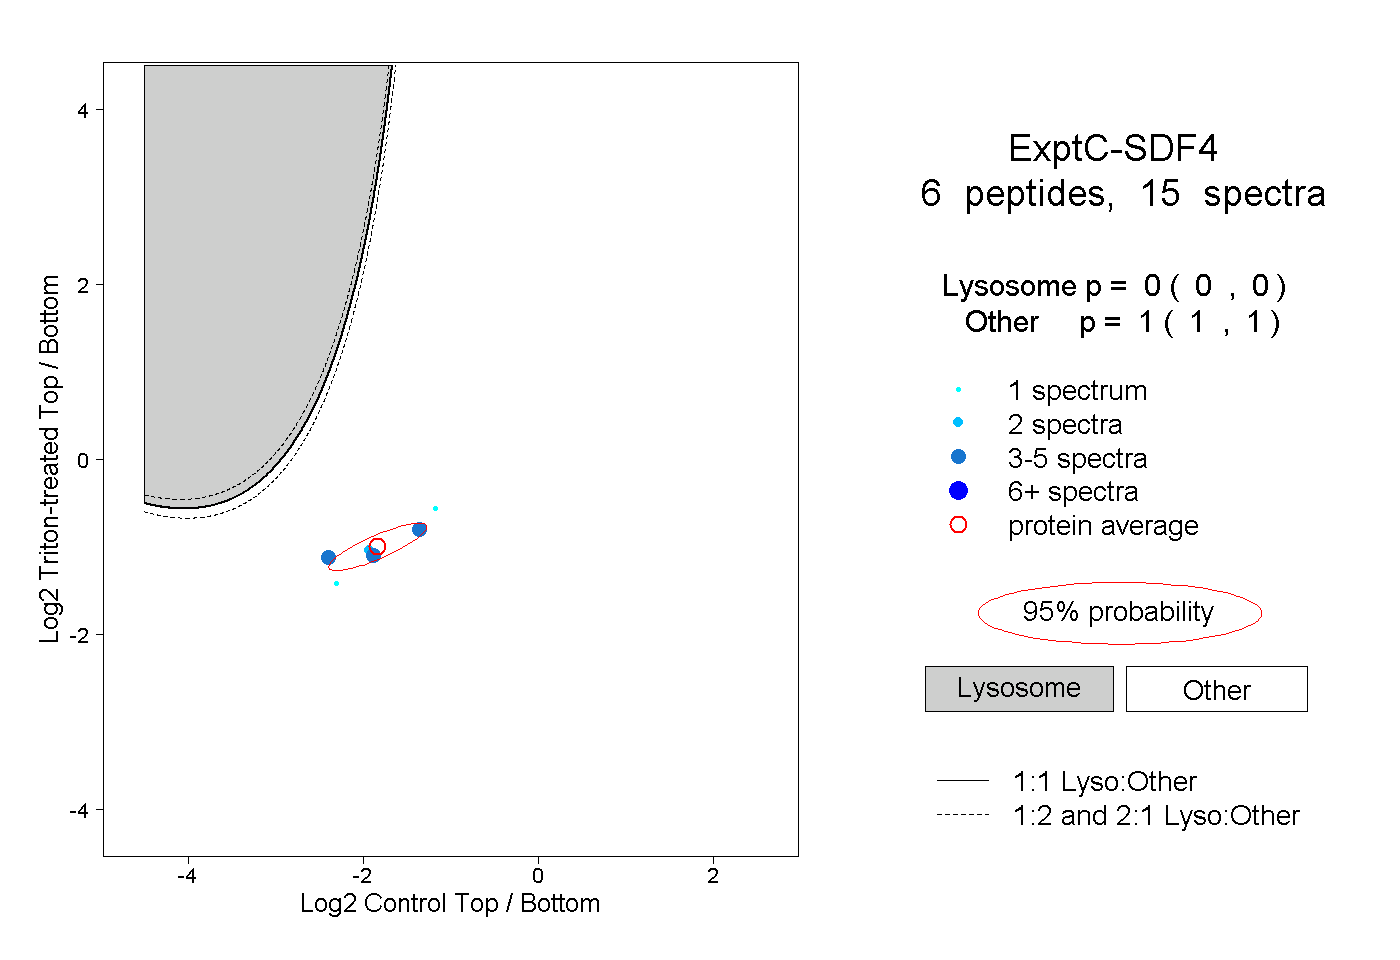
| Expt C |
6
peptides |
15
spectra |
 |
|
0.000
0.000 | 0.000 |
|
|
|
|
|
|
|
1.000
1.000 | 1.000 |
| 1 spectrum, YSEFFTGSK |
|
0.000 |
|
|
|
|
|
|
|
1.000 |
| 2 spectra, EIADAIK |
|
0.000 |
|
|
|
|
|
|
|
1.000 |
| 3 spectra, LEMDGHLNK |
|
0.000 |
|
|
|
|
|
|
|
1.000 |
| 4 spectra, TAEHFQEAVK |
|
0.000 |
|
|
|
|
|
|
|
1.000 |
| 1 spectrum, LMDYAR |
|
0.000 |
|
|
|
|
|
|
|
1.000 |
| 4 spectra, DLDQDGDK |
|
0.000 |
|
|
|
|
|
|
|
1.000 |
| | | Plot |
|
Lyso |
|
|
|
|
|
|
|
Other |
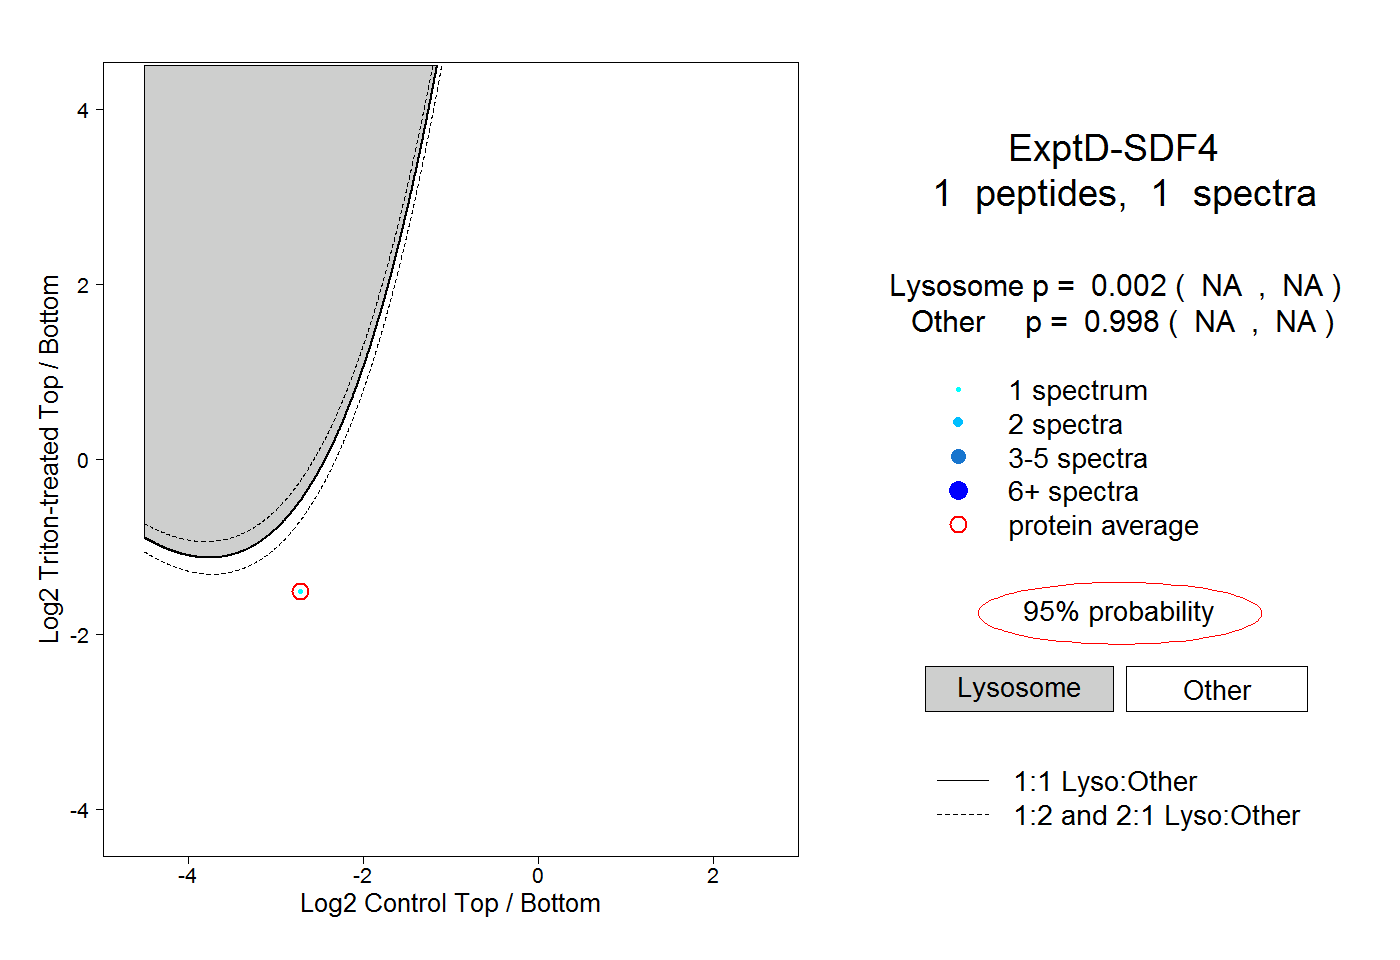
| Expt D |
1
peptide |
1
spectrum |
 |
|
0.002
NA | NA |
|
|
|
|
|
|
|
0.998
NA | NA |