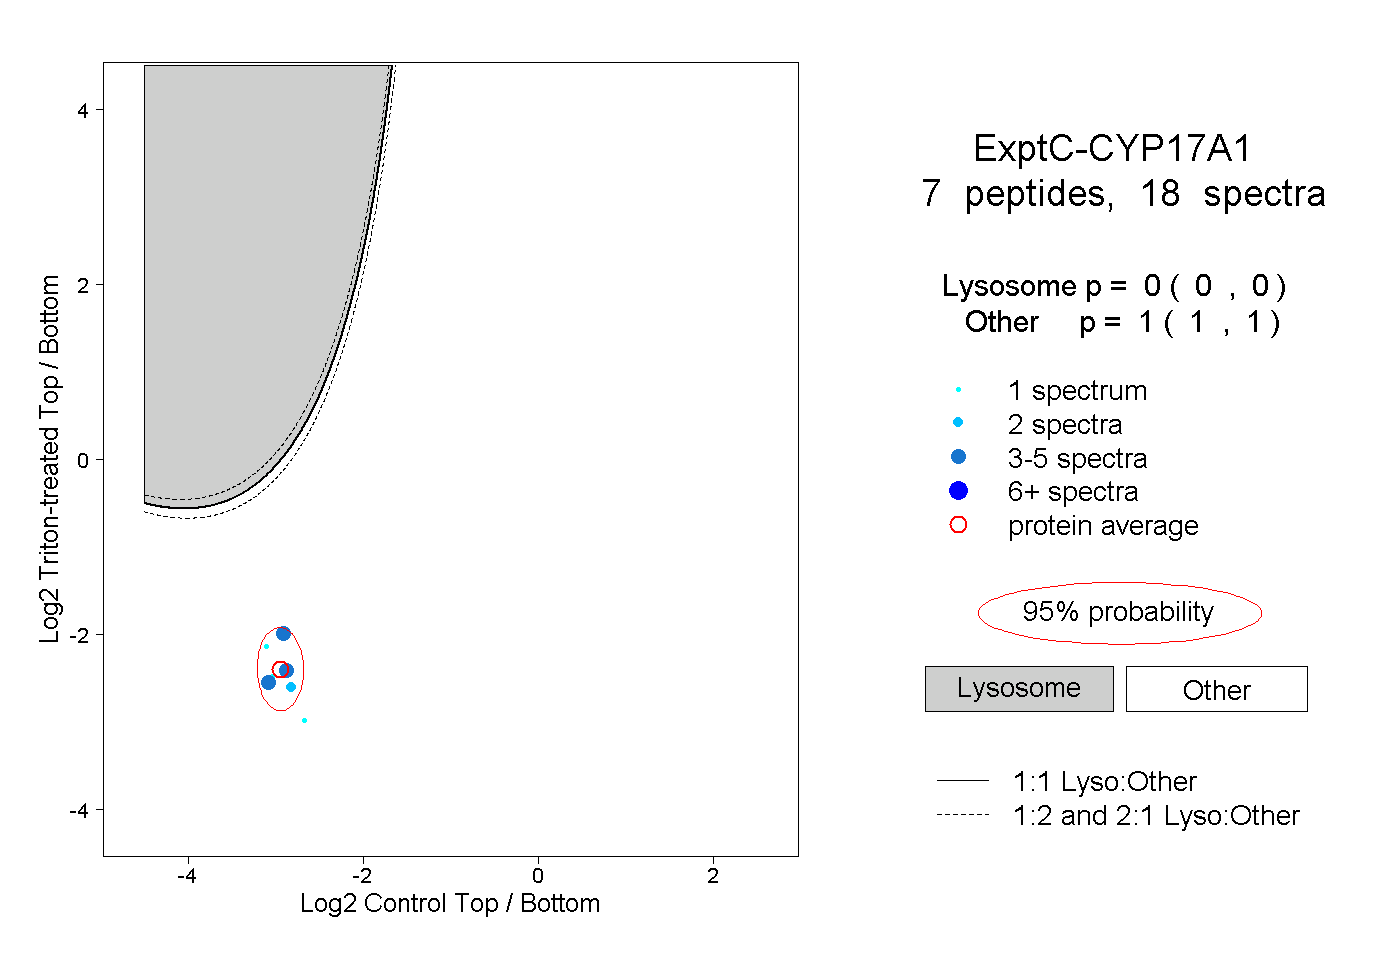
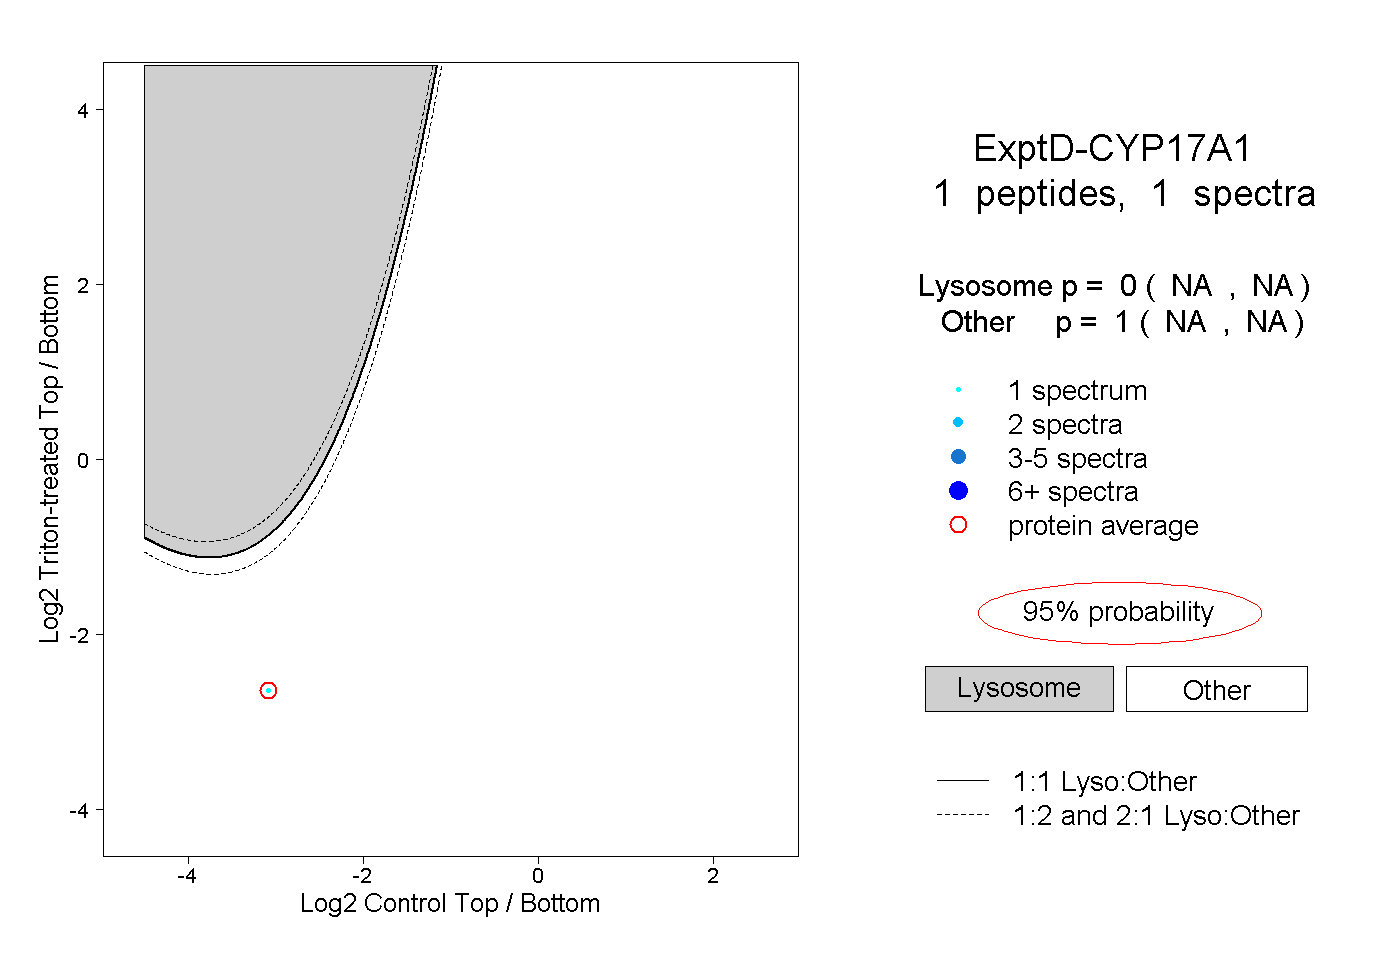
CYP17A1
[ENSRNOP00000027160]
Main page
| | | Plot |
Mito |
Lyso |
|
Perox |
ER |
Golgi |
PM |
Cytosol |
Nucleus |
|
| Expt A |
 12
12
peptides |
30
spectra |
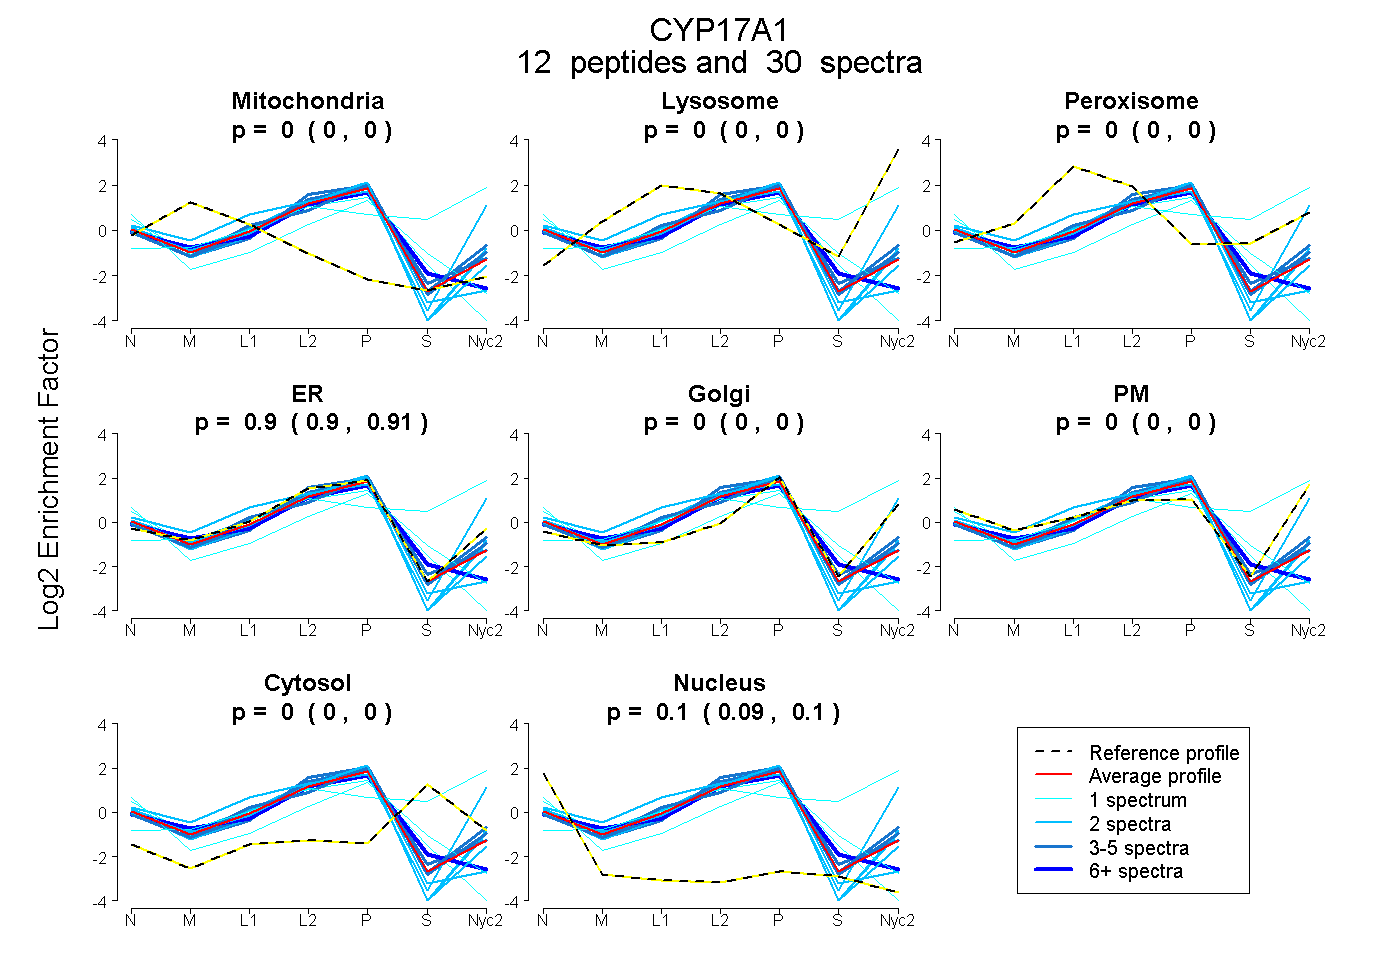 |
0.000
0.000 | 0.000 |
0.000
0.000 | 0.000 |
|
0.000
0.000 | 0.000 |
0.904
0.897 | 0.910 |
0.000
0.000 | 0.000 |
0.000
0.000 | 0.000 |
0.000
0.000 | 0.000 |
0.096
0.089 | 0.102 |
|
| | | Plot |
Mito |
|
Lyso or Perox |
|
ER |
Golgi |
PM |
Cytosol |
Nucleus |
|
| Expt B |
1
peptide |
9
spectra |
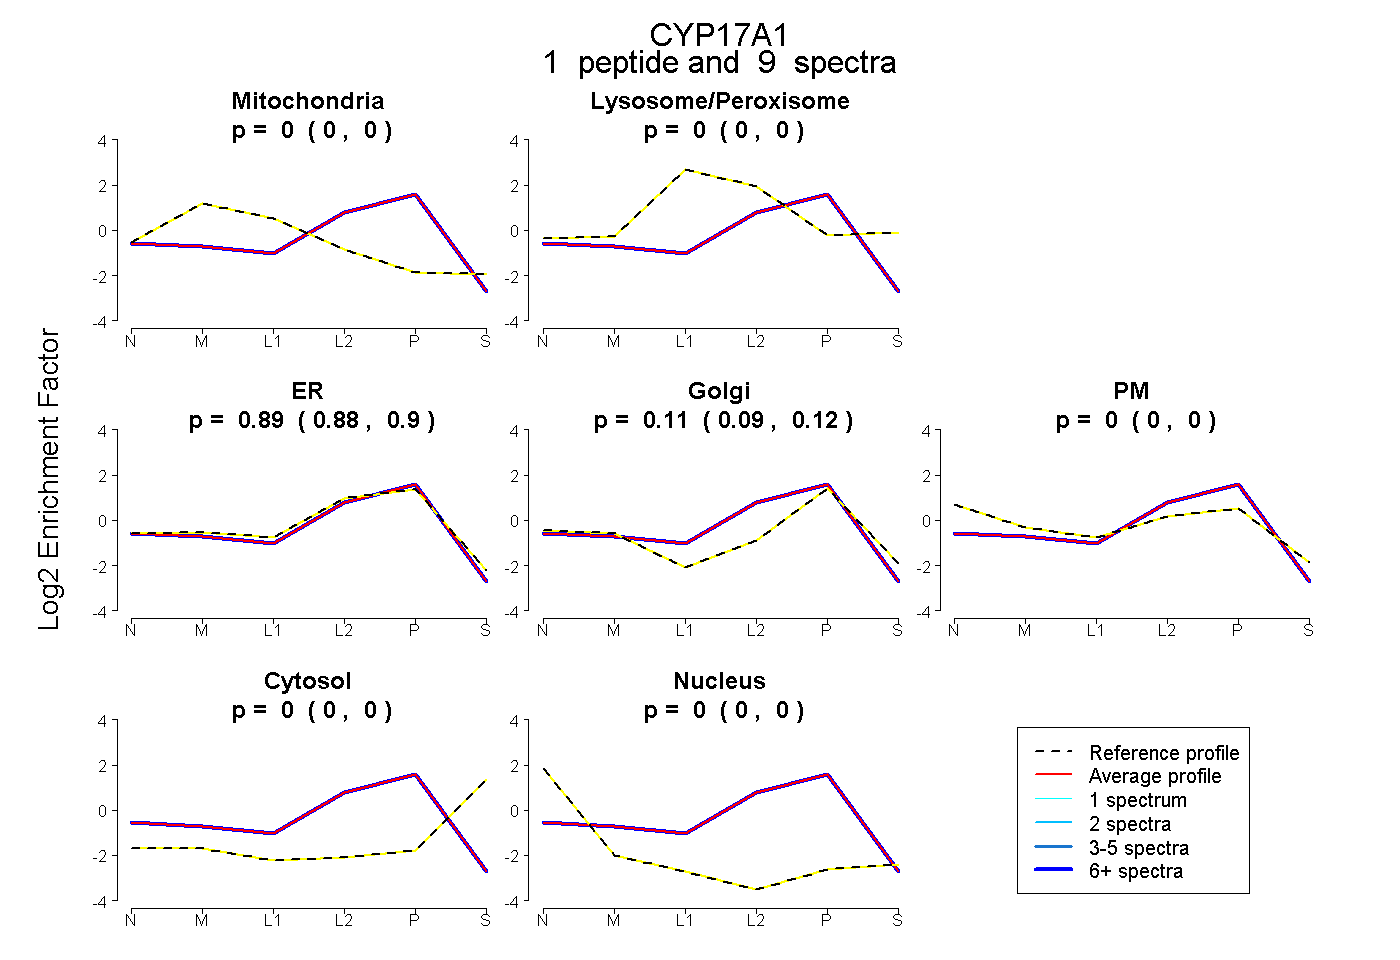 |
0.000
0.000 | 0.000 |
|
0.000
0.000 | 0.000 |
|
0.893
0.880 | 0.904 |
0.107
0.093 | 0.118 |
0.000
0.000 | 0.000 |
0.000
0.000 | 0.000 |
0.000
0.000 | 0.000 |
|
| | | Plot |
|
Lyso |
|
|
|
|
|
|
|
Other |
| Expt C |
7
peptides |
18
spectra |
 |
|
0.000
0.000 | 0.000 |
|
|
|
|
|
|
|
1.000
1.000 | 1.000 |
| 2 spectra, TFTEGIVDATGDR |
|
0.000 |
|
|
|
|
|
|
|
1.000 |
| 4 spectra, YGPIYSLR |
|
0.000 |
|
|
|
|
|
|
|
1.000 |
| 4 spectra, SCIGEALAR |
|
0.000 |
|
|
|
|
|
|
|
1.000 |
| 1 spectrum, VVFLIDPFK |
|
0.000 |
|
|
|
|
|
|
|
1.000 |
| 1 spectrum, DPDVFSDR |
|
0.000 |
|
|
|
|
|
|
|
1.000 |
| 5 spectra, IRPVAPMLIPHK |
|
0.000 |
|
|
|
|
|
|
|
1.000 |
| 1 spectrum, EIDQYVGFSR |
|
0.000 |
|
|
|
|
|
|
|
1.000 |
| | | Plot |
|
Lyso |
|
|
|
|
|
|
|
Other |
| Expt D |
1
peptide |
1
spectrum |
 |
|
0.000
NA | NA |
|
|
|
|
|
|
|
1.000
NA | NA |