 3
3peptides
spectra
0.000 | 0.000
0.601 | 0.817
0.000 | 0.223
0.000 | 0.000
0.000 | 0.000
0.000 | 0.000
0.096 | 0.268
0.000 | 0.000
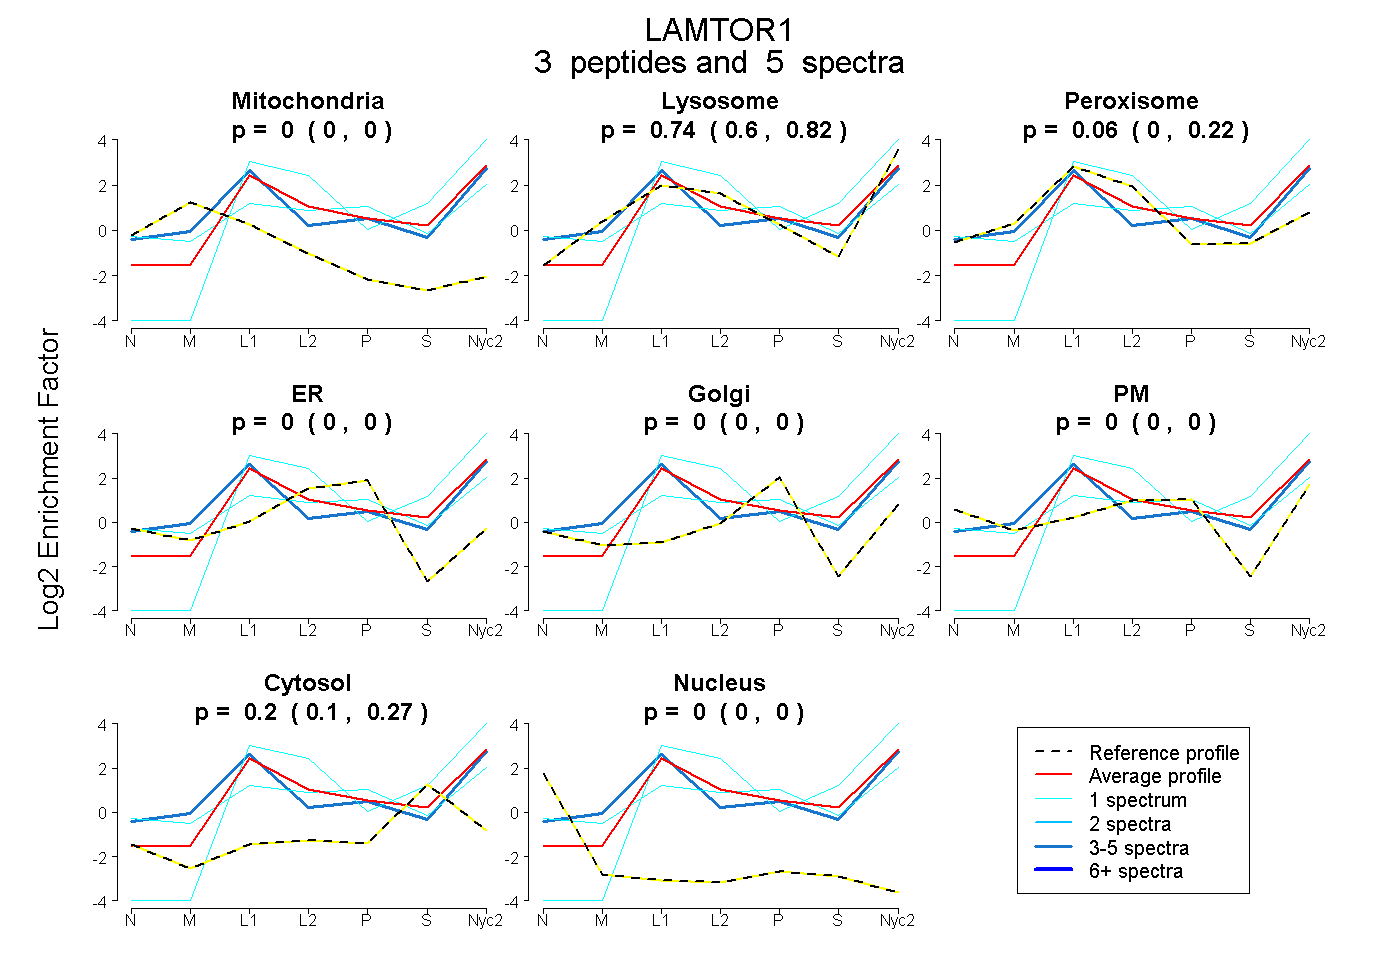
| Plot | Mito | Lyso | Perox | ER | Golgi | PM | Cytosol | Nucleus | |||||
| Expt A |
3 peptides |
5 spectra |
|
0.000 0.000 | 0.000 |
0.743 0.601 | 0.817 |
0.061 0.000 | 0.223 |
0.000 0.000 | 0.000 |
0.000 0.000 | 0.000 |
0.000 0.000 | 0.000 |
0.195 0.096 | 0.268 |
0.000 0.000 | 0.000 |
| 1 spectrum, TDEQALLSSILAK | 0.000 | 0.401 | 0.162 | 0.000 | 0.114 | 0.182 | 0.141 | 0.000 | ||
| 3 spectra, LAVLSSSLTHWK | 0.000 | 0.605 | 0.248 | 0.000 | 0.000 | 0.061 | 0.086 | 0.000 | ||
| 1 spectrum, TASNIIDVSAADSQGMEQHEYMDR | 0.000 | 0.808 | 0.000 | 0.000 | 0.000 | 0.000 | 0.192 | 0.000 |
| Plot | Mito | Lyso or Perox | ER | Golgi | PM | Cytosol | Nucleus | ||||||
| Expt B |
2 peptides |
2 spectra |
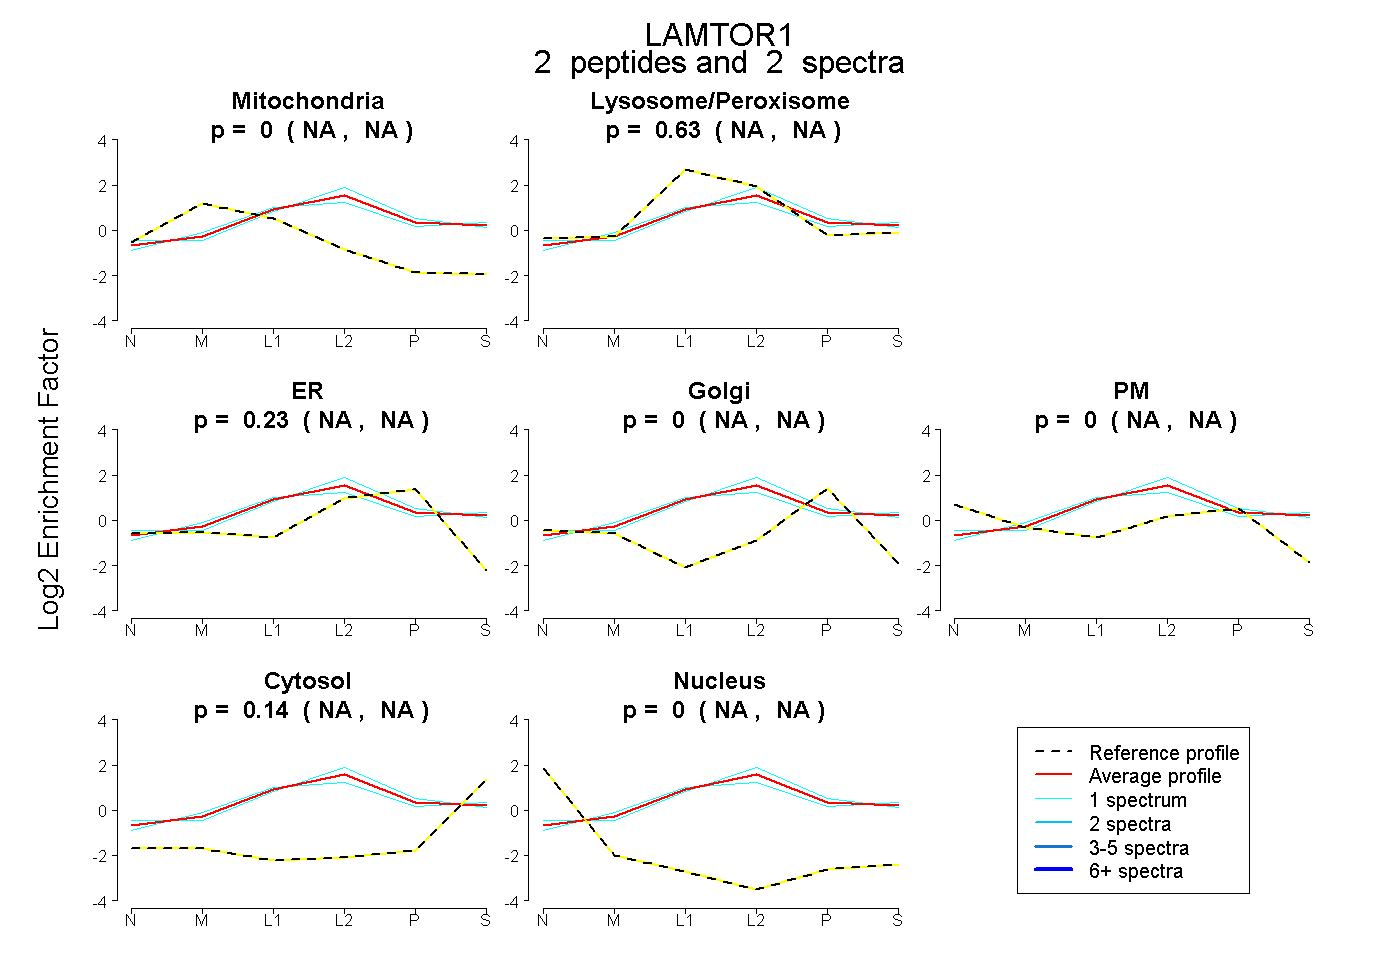 |
0.000 NA | NA |
0.634 NA | NA |
0.230 NA | NA |
0.000 NA | NA |
0.000 NA | NA |
0.136 NA | NA |
0.000 NA | NA |
|||
| Plot | Lyso | Other | |||||||||||
| Expt C |
3 peptides |
11 spectra |
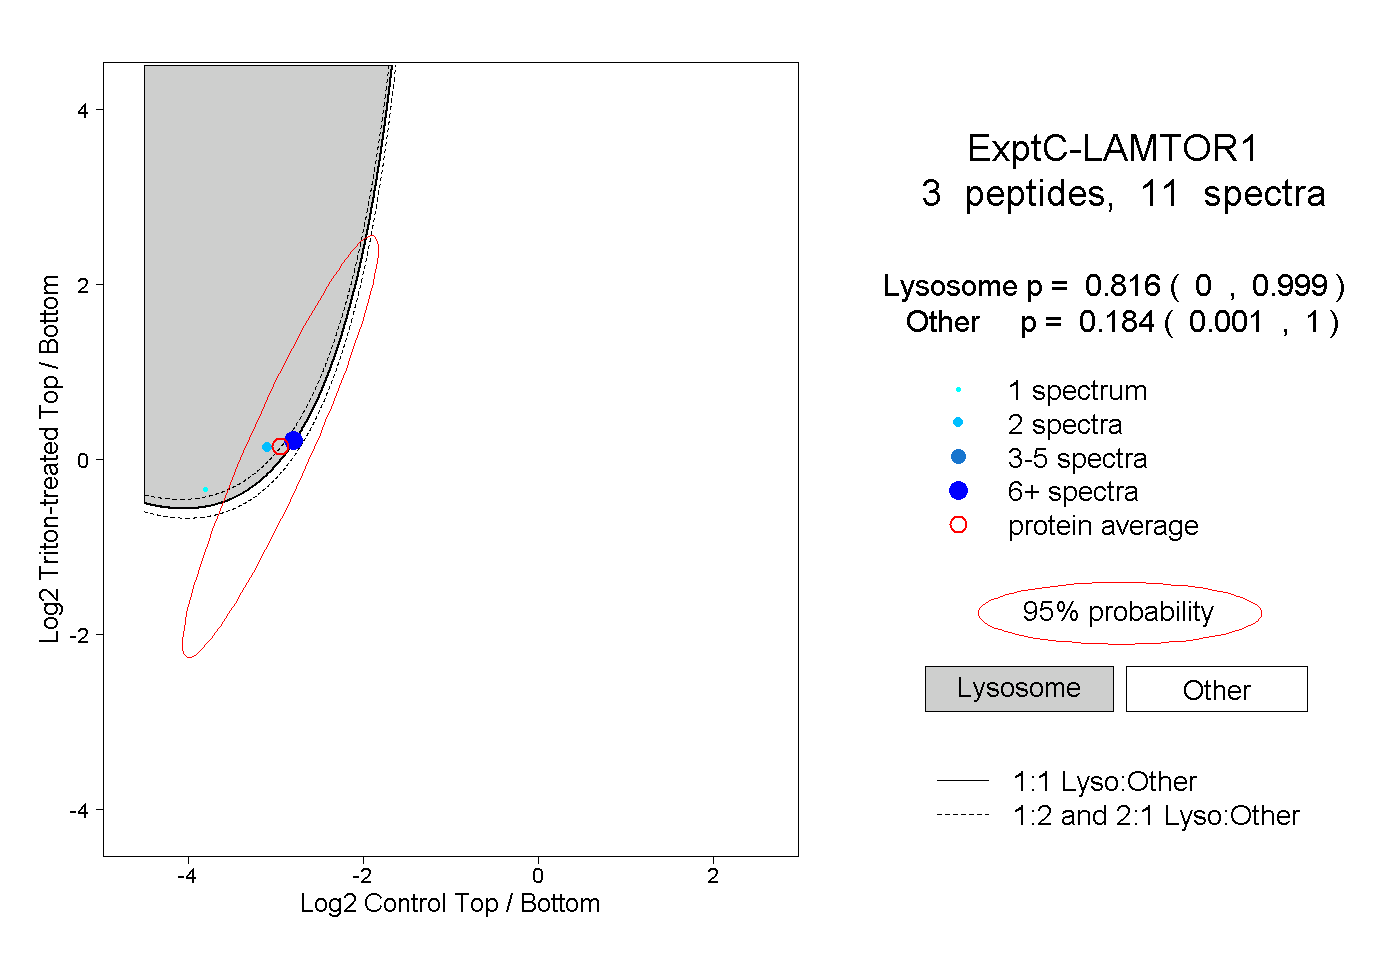 |
0.816 0.000 | 0.999 |
0.184 0.001 | 1.000 |
||||||||
| Plot | Lyso | Other | |||||||||||
| Expt D |
2 peptides |
2 spectra |
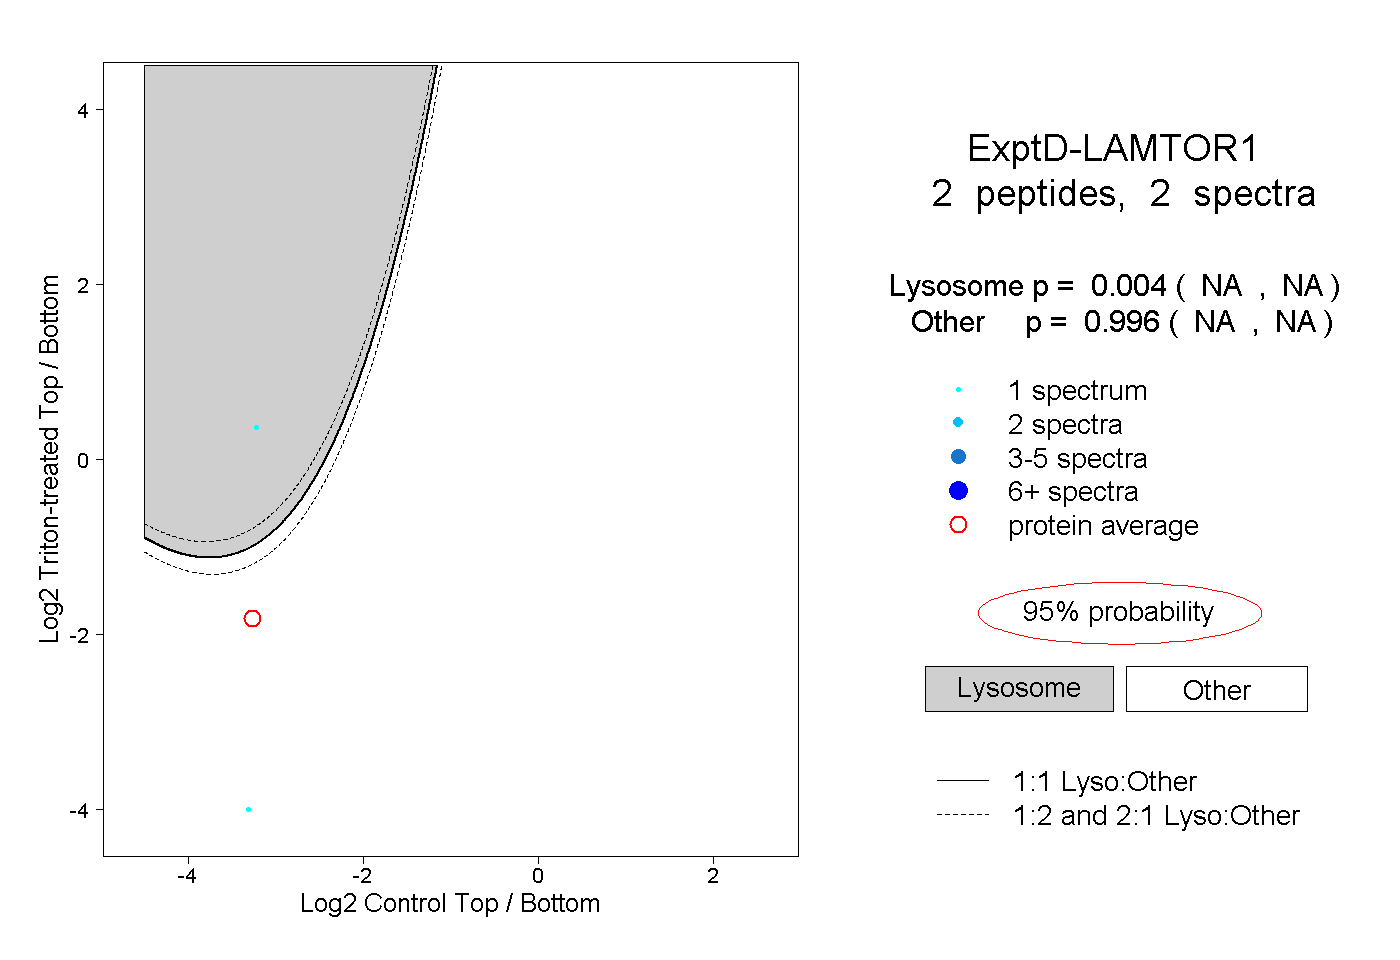 |
0.004 NA | NA |
0.996 NA | NA |