 20
20peptides
spectra
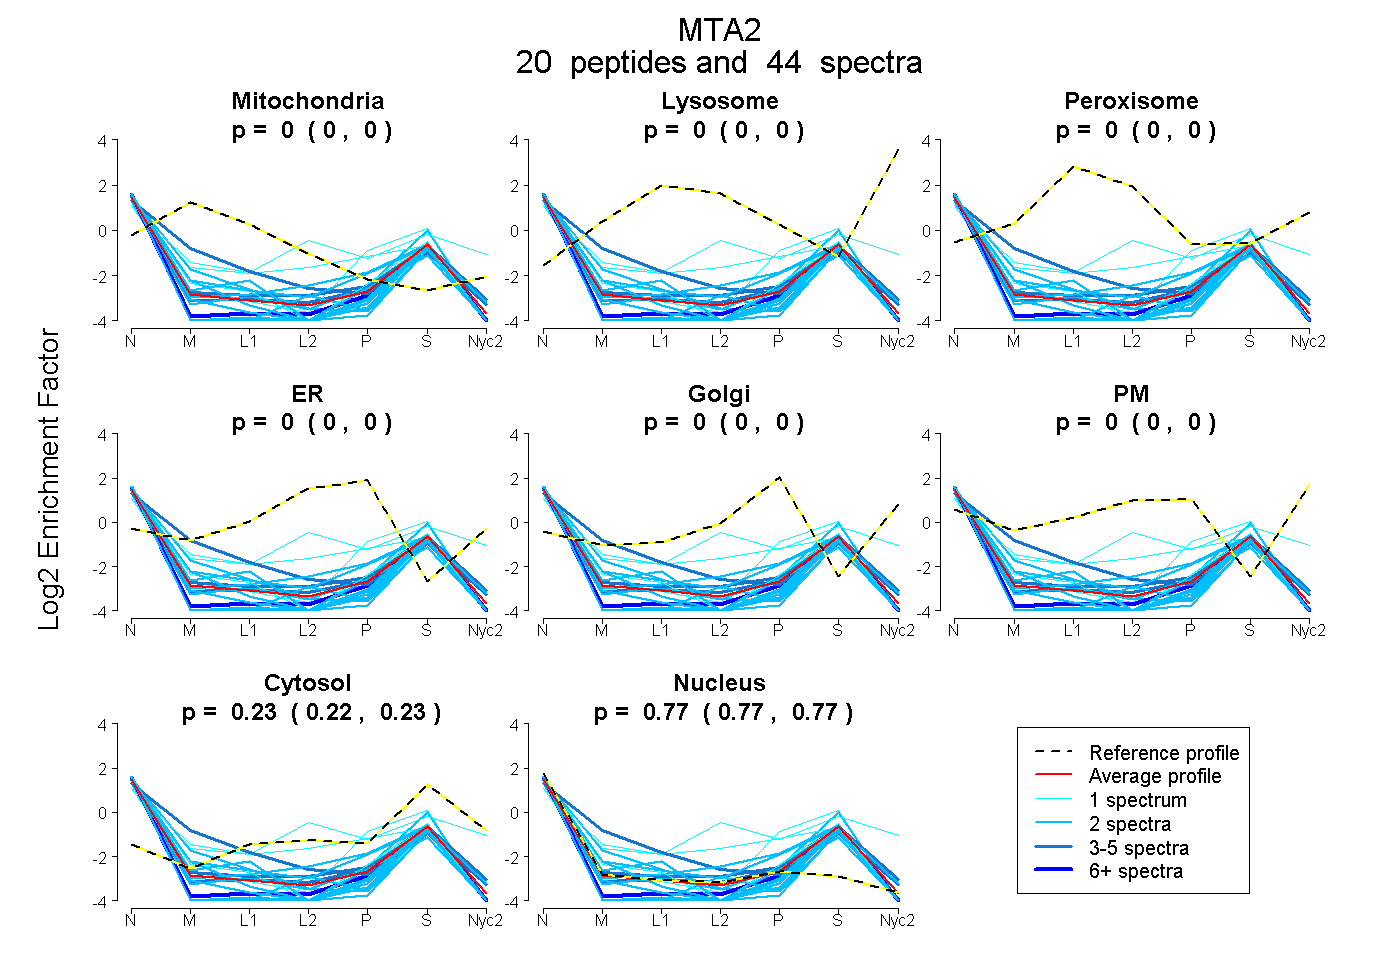
0.000 | 0.000
0.000 | 0.000
0.000 | 0.000
0.000 | 0.000
0.000 | 0.000
0.000 | 0.000
0.225 | 0.233
0.766 | 0.775
2peptides
spectra
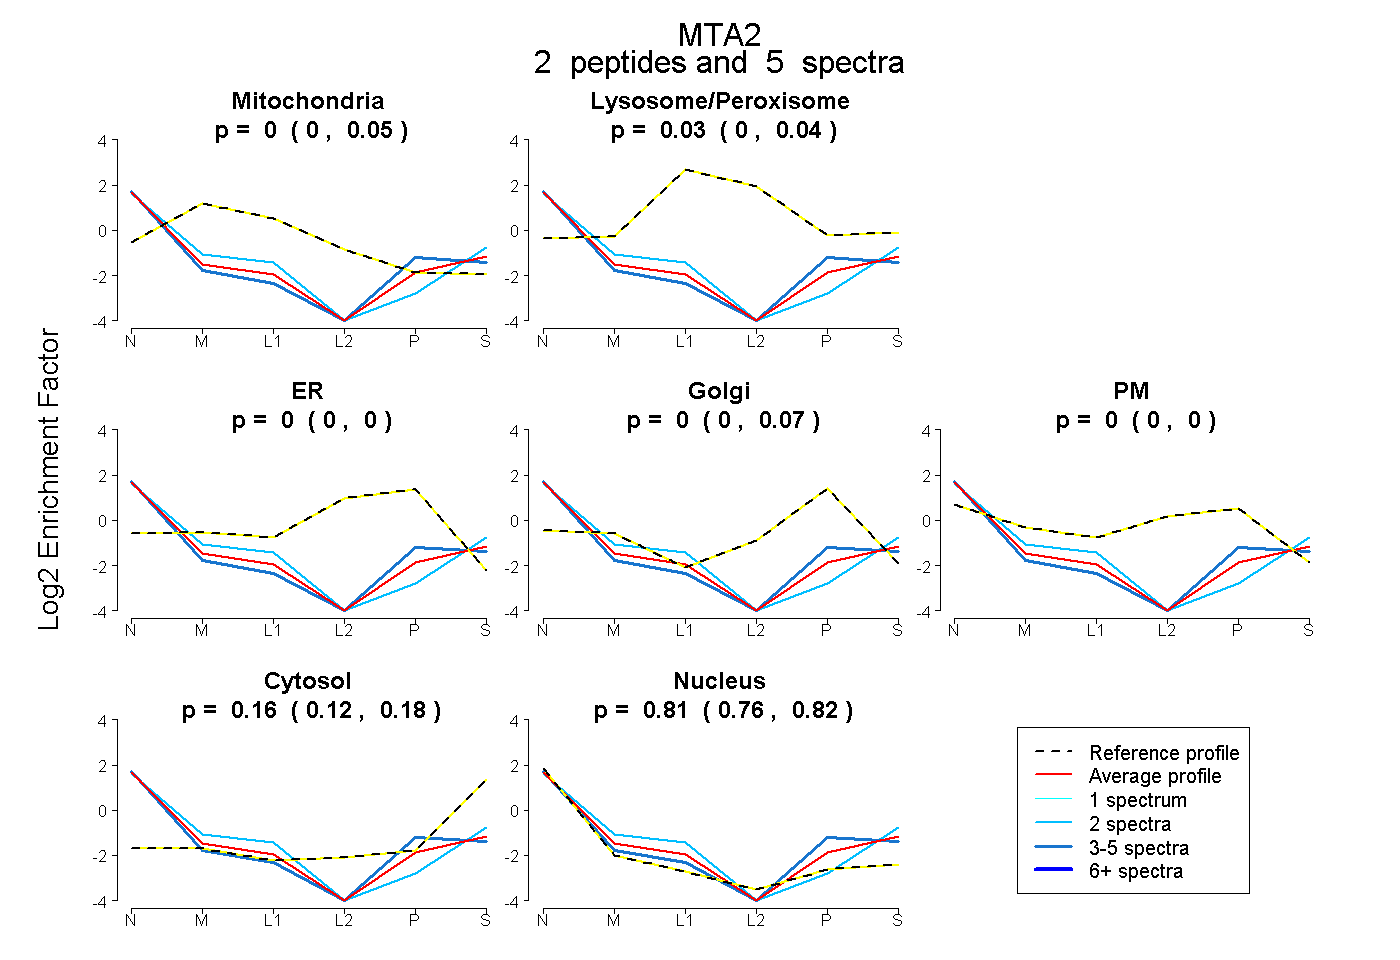
0.000 | 0.050
0.000 | 0.041
0.000 | 0.000
0.000 | 0.069
0.000 | 0.000
0.122 | 0.185
0.762 | 0.822