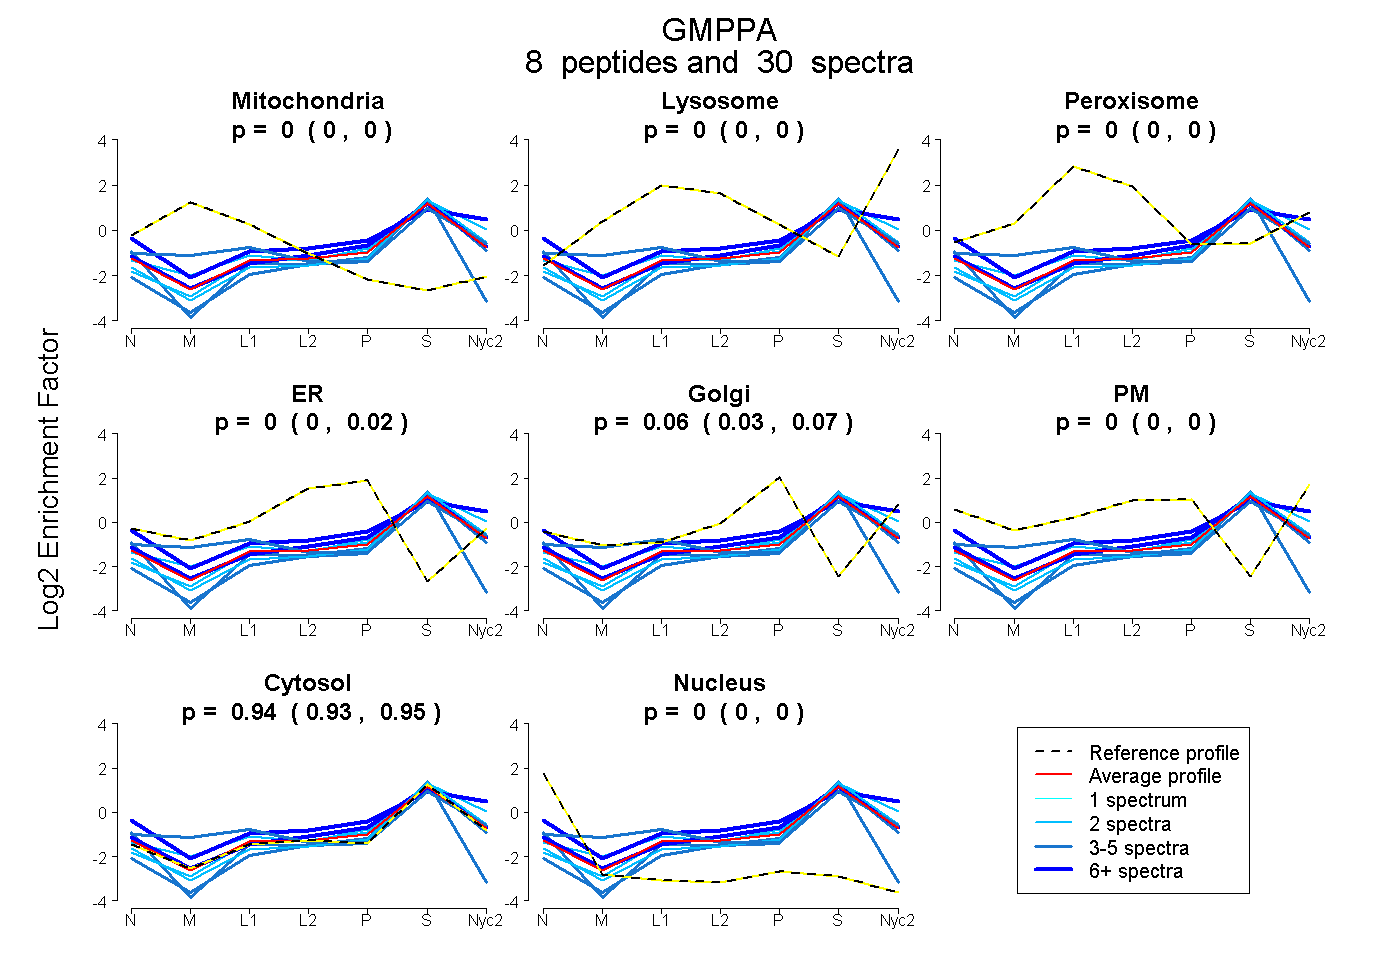
GMPPA
[ENSRNOP00000027064]

Main page
Plot Mito Lyso Perox ER Golgi PM Cytosol Nucleus
Expt A 8
peptides
30
spectra
0.000
0.000 | 0.000
0.000
0.000 | 0.000

0.000
0.000 | 0.000
0.000
0.000 | 0.016
0.057
0.028 | 0.066
0.000
0.000 | 0.000
0.943
0.932 | 0.951
0.000
0.000 | 0.000

Plot Mito Lyso or Perox ER Golgi PM Cytosol Nucleus
Expt B 5
peptides
11
spectra
0.000
0.000 | 0.000

0.000
0.000 | 0.034

0.096
0.000 | 0.126
0.024
0.000 | 0.118
0.000
0.000 | 0.026
0.880
0.844 | 0.897
0.000
0.000 | 0.000

4 spectra, HPFLLLGTTANR 0.022 0.238 0.000 0.036 0.000 0.703 0.000
1 spectrum, VAPSAVLGPNVSIGK 0.000 0.000 0.000 0.000 0.000 1.000 0.000
3 spectra, GVTIGEGVR 0.000 0.000 0.000 0.000 0.000 0.987 0.013
2 spectra, SAGSALYASR 0.000 0.000 0.000 0.102 0.000 0.898 0.000
1 spectrum, YQITHPER 0.000 0.148 0.000 0.116 0.347 0.389 0.000
Plot Lyso Other
Expt C 9
peptides
34
spectra

0.000
0.000 | 0.000


1.000
1.000 | 1.000
Plot Lyso Other
Expt D 2
peptides
3
spectra

0.000
0.000 | 0.000


1.000
1.000 | 1.000

Calculate protein distances from select experiments.
Maximum number of results     Minimum number of peptides     Minimum number of spectra    
Expt A     Expt B     Expt C     Expt D