 4
4peptides
spectra
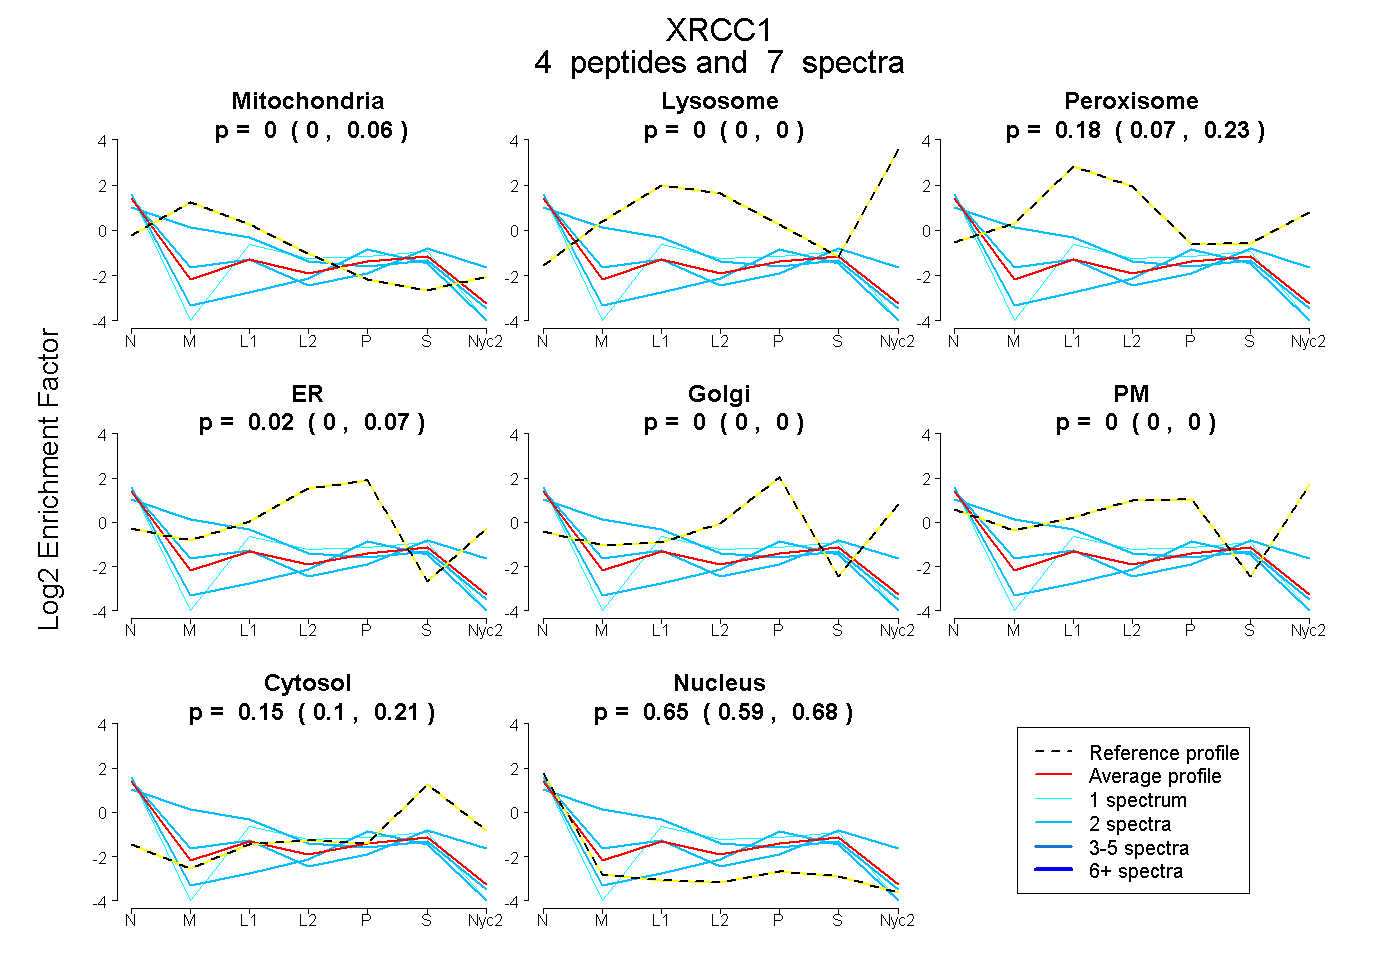
0.000 | 0.061
0.000 | 0.000
0.068 | 0.235
0.000 | 0.073
0.000 | 0.000
0.000 | 0.000
0.096 | 0.212
0.594 | 0.676
| Plot | Mito | Lyso | Perox | ER | Golgi | PM | Cytosol | Nucleus | |||||
| Expt A |
4 peptides |
7 spectra |
|
0.000 0.000 | 0.061 |
0.000 0.000 | 0.000 |
0.177 0.068 | 0.235 |
0.021 0.000 | 0.073 |
0.000 0.000 | 0.000 |
0.000 0.000 | 0.000 |
0.153 0.096 | 0.212 |
0.650 0.594 | 0.676 |
| 1 spectrum, DSPYGLSFVK | 0.000 | 0.000 | 0.096 | 0.077 | 0.000 | 0.000 | 0.213 | 0.615 | ||
| 2 spectra, IFGPDK | 0.001 | 0.000 | 0.198 | 0.000 | 0.000 | 0.009 | 0.237 | 0.555 | ||
| 2 spectra, LLPHQLYGVVPQA | 0.556 | 0.000 | 0.081 | 0.000 | 0.000 | 0.000 | 0.052 | 0.311 | ||
| 2 spectra, TPAATPASTPAQK | 0.000 | 0.000 | 0.000 | 0.092 | 0.000 | 0.000 | 0.153 | 0.755 |
| Plot | Lyso | Other | |||||||||||
| Expt C |
1 peptide |
4 spectra |
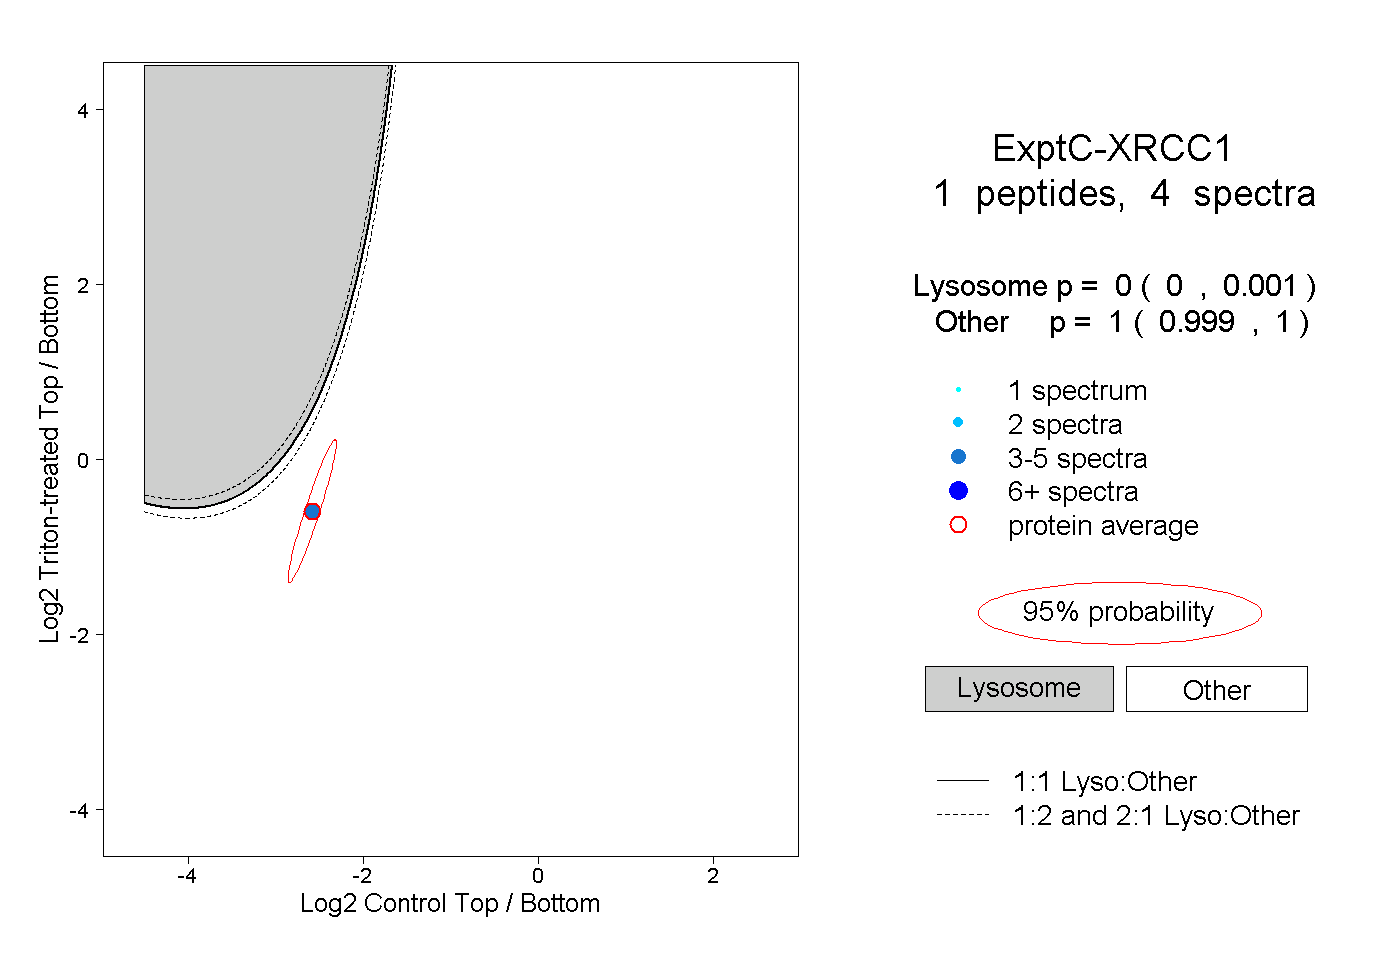 |
0.000 0.000 | 0.001 |
1.000 0.999 | 1.000 |