 2
2peptides
spectra
0.000 | 0.000
0.000 | 0.184
0.000 | 0.133
0.000 | 0.228
0.000 | 0.137
0.364 | 0.814
0.103 | 0.249
0.000 | 0.000
1peptide
spectra
0.000 | 0.000
1.000 | 1.000
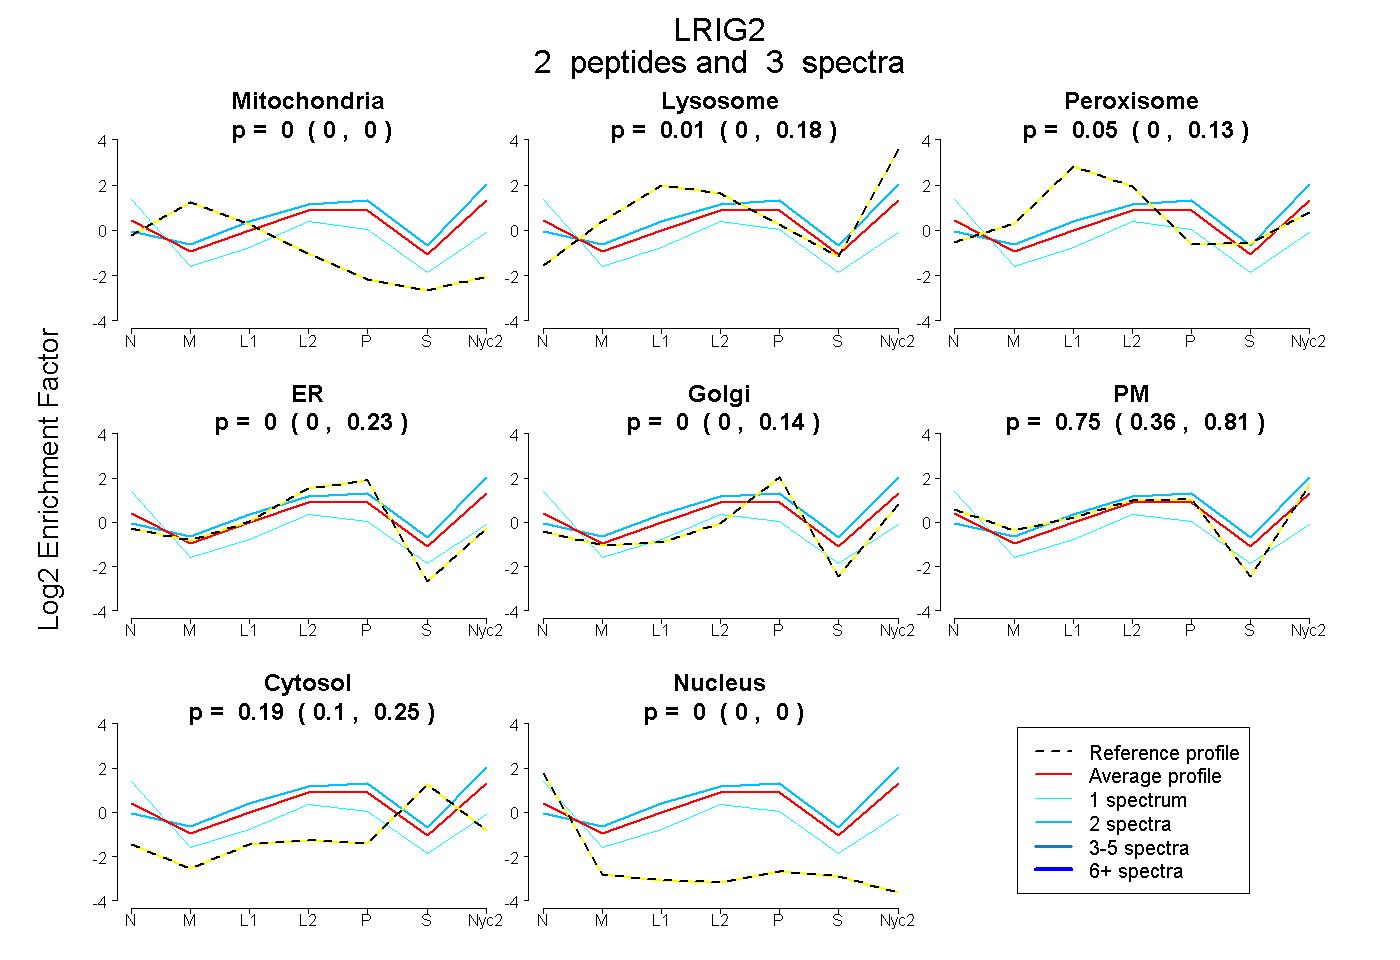
| Plot | Mito | Lyso | Perox | ER | Golgi | PM | Cytosol | Nucleus | |||||
| Expt A |
2 peptides |
3 spectra |
|
0.000 0.000 | 0.000 |
0.013 0.000 | 0.184 |
0.046 0.000 | 0.133 |
0.000 0.000 | 0.228 |
0.000 0.000 | 0.137 |
0.747 0.364 | 0.814 |
0.194 0.103 | 0.249 |
0.000 0.000 | 0.000 |
||
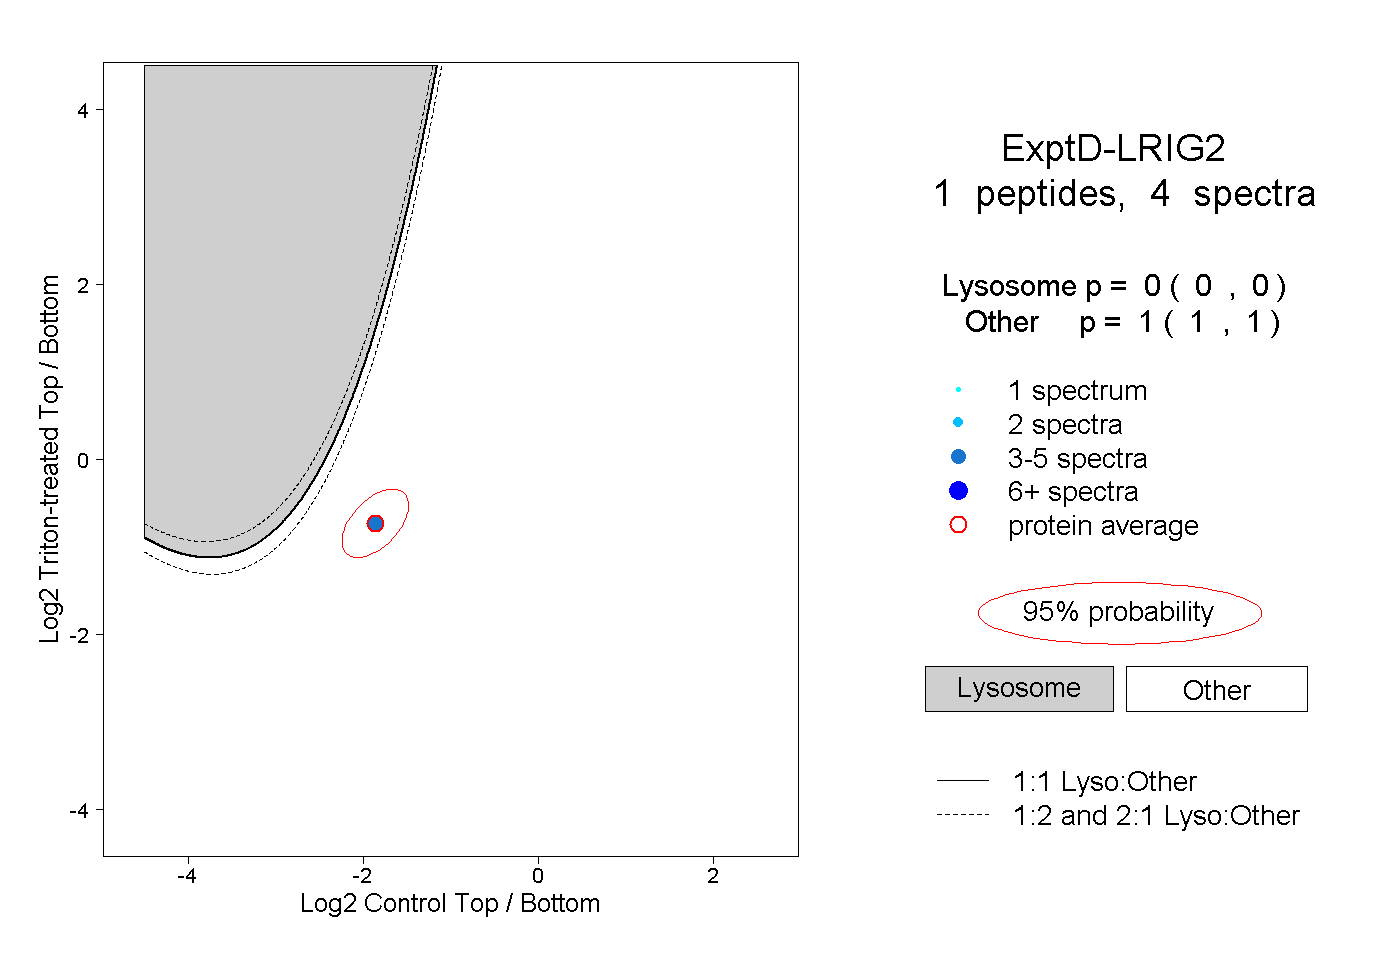
| Plot | Lyso | Other | |||||||||||
| Expt D |
1 peptide |
4 spectra |
|
0.000 0.000 | 0.000 |
1.000 1.000 | 1.000 |