 4
4peptides
spectra
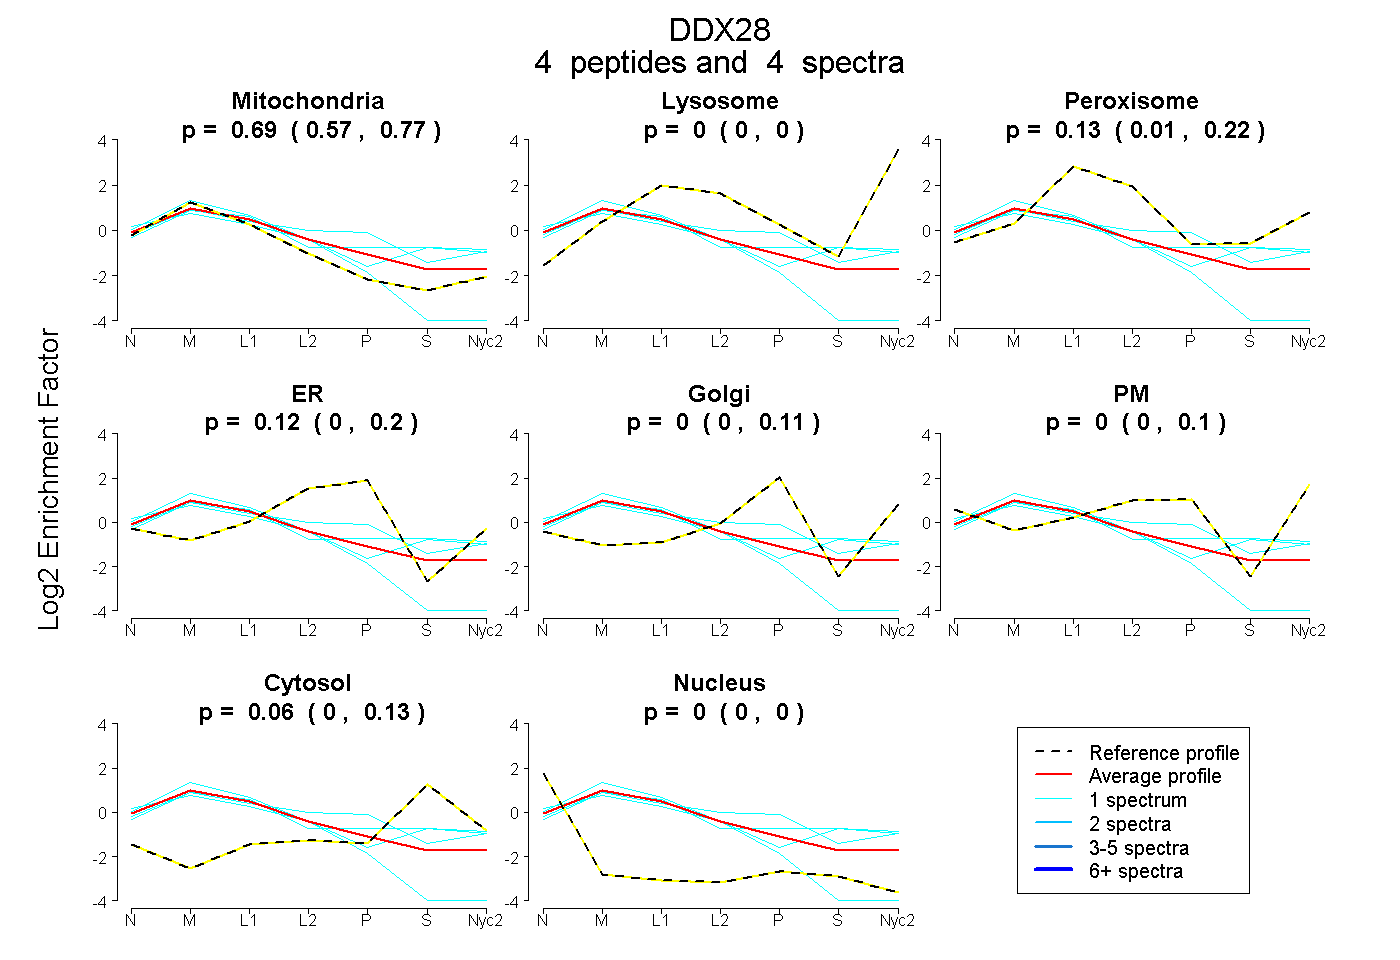
0.574 | 0.772
0.000 | 0.000
0.011 | 0.216
0.000 | 0.204
0.000 | 0.107
0.000 | 0.097
0.000 | 0.128
0.000 | 0.004
2peptides
spectra
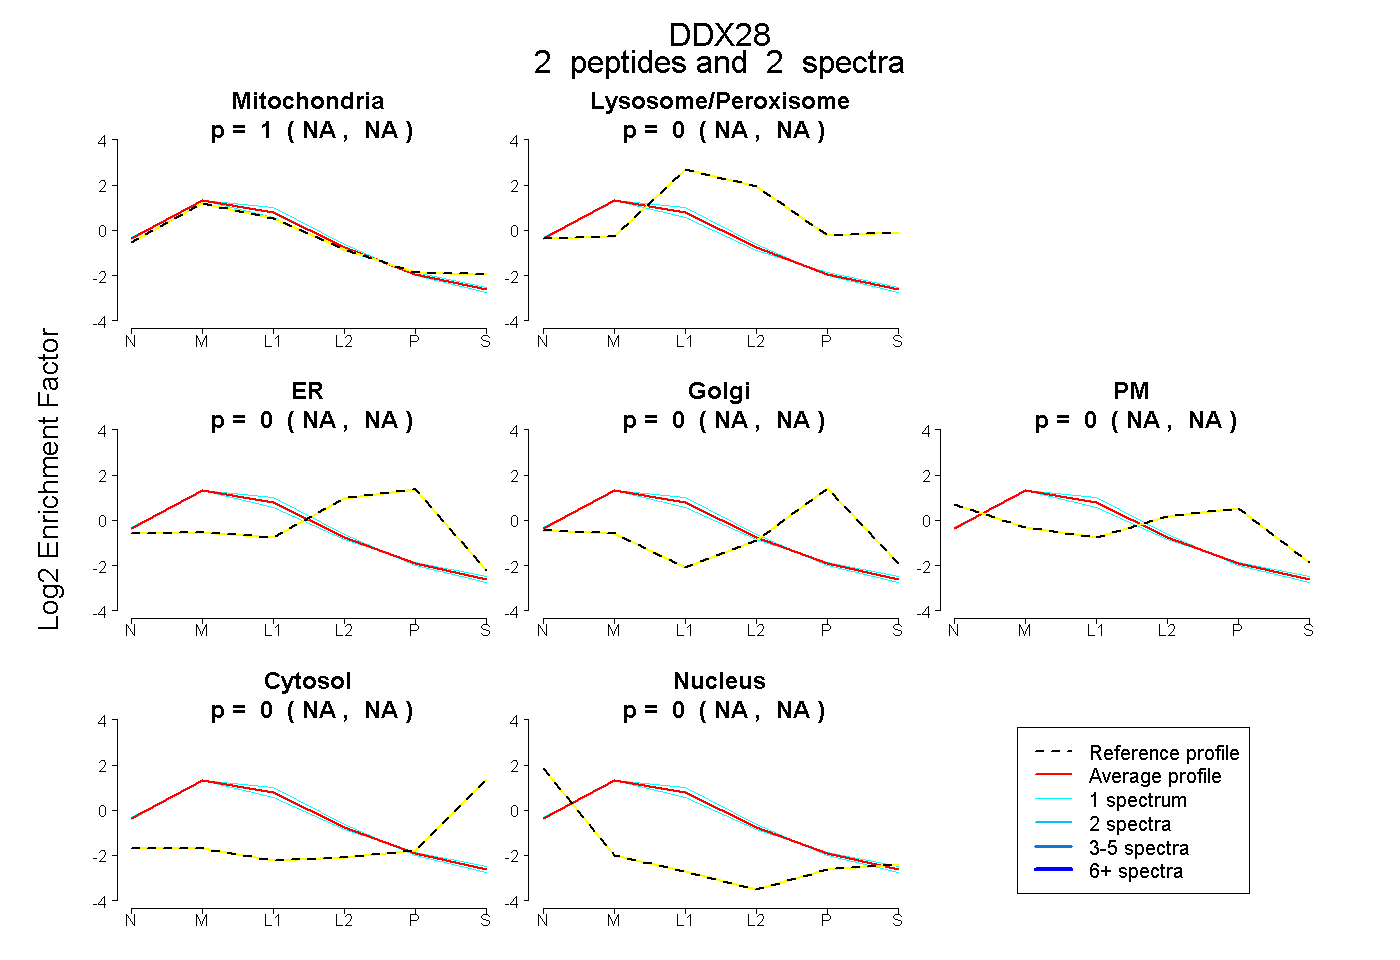
NA | NA
NA | NA
NA | NA
NA | NA
NA | NA
NA | NA
NA | NA
11peptides
spectra
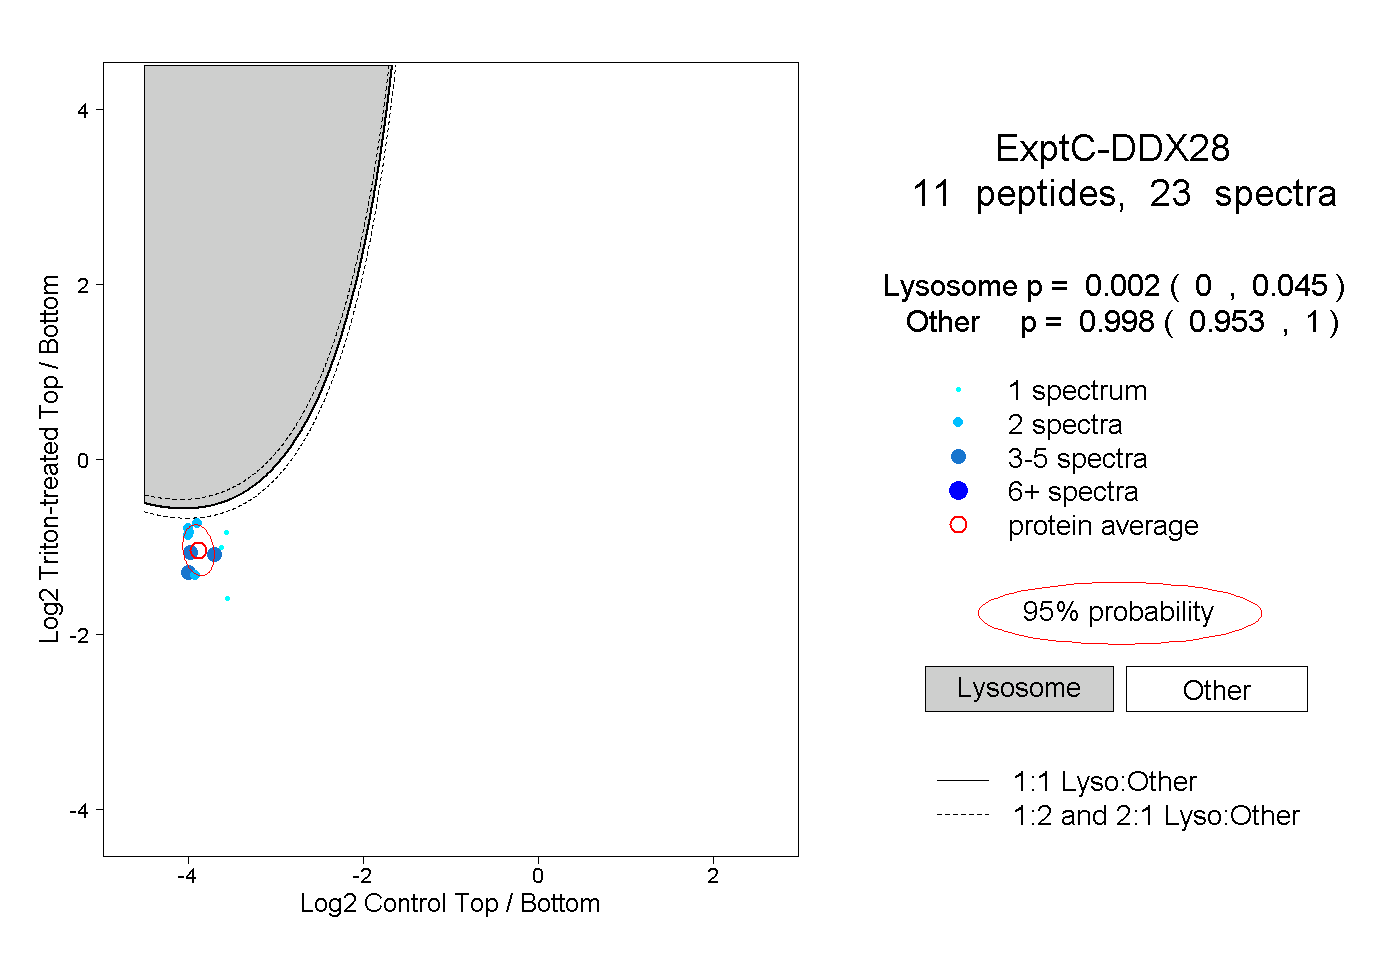
0.000 | 0.045
0.953 | 1.000