 4
4peptides
spectra
0.574 | 0.772
0.000 | 0.000
0.011 | 0.216
0.000 | 0.204
0.000 | 0.107
0.000 | 0.097
0.000 | 0.128
0.000 | 0.004
| Plot | Mito | Lyso | Perox | ER | Golgi | PM | Cytosol | Nucleus | |||||
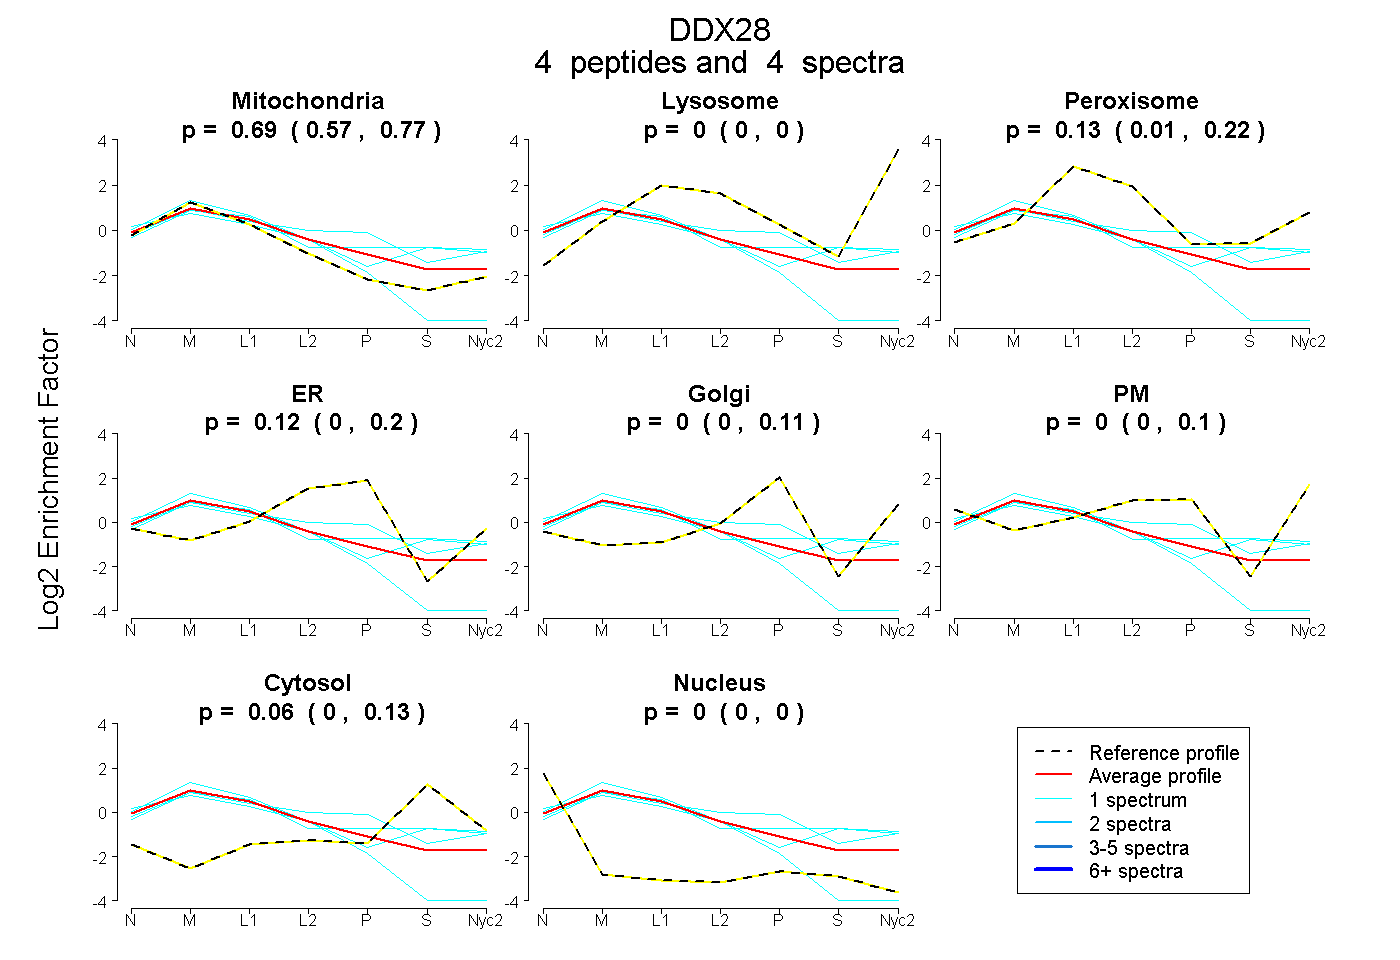
| Expt A |
4 peptides |
4 spectra |
|
0.687 0.574 | 0.772 |
0.000 0.000 | 0.000 |
0.130 0.011 | 0.216 |
0.124 0.000 | 0.204 |
0.000 0.000 | 0.107 |
0.000 0.000 | 0.097 |
0.059 0.000 | 0.128 |
0.000 0.000 | 0.004 |
| 1 spectrum, VTELIQILK | 0.455 | 0.000 | 0.218 | 0.113 | 0.175 | 0.000 | 0.038 | 0.000 | ||
| 1 spectrum, SPIAESPAELEDPFNPK | 0.544 | 0.000 | 0.231 | 0.000 | 0.000 | 0.018 | 0.207 | 0.000 | ||
| 1 spectrum, LHCIMPHVR | 0.977 | 0.000 | 0.000 | 0.000 | 0.000 | 0.000 | 0.000 | 0.023 | ||
| 1 spectrum, GLVLVPSR | 0.482 | 0.001 | 0.260 | 0.000 | 0.085 | 0.000 | 0.173 | 0.000 |
| Plot | Mito | Lyso or Perox | ER | Golgi | PM | Cytosol | Nucleus | ||||||
| Expt B |
2 peptides |
2 spectra |
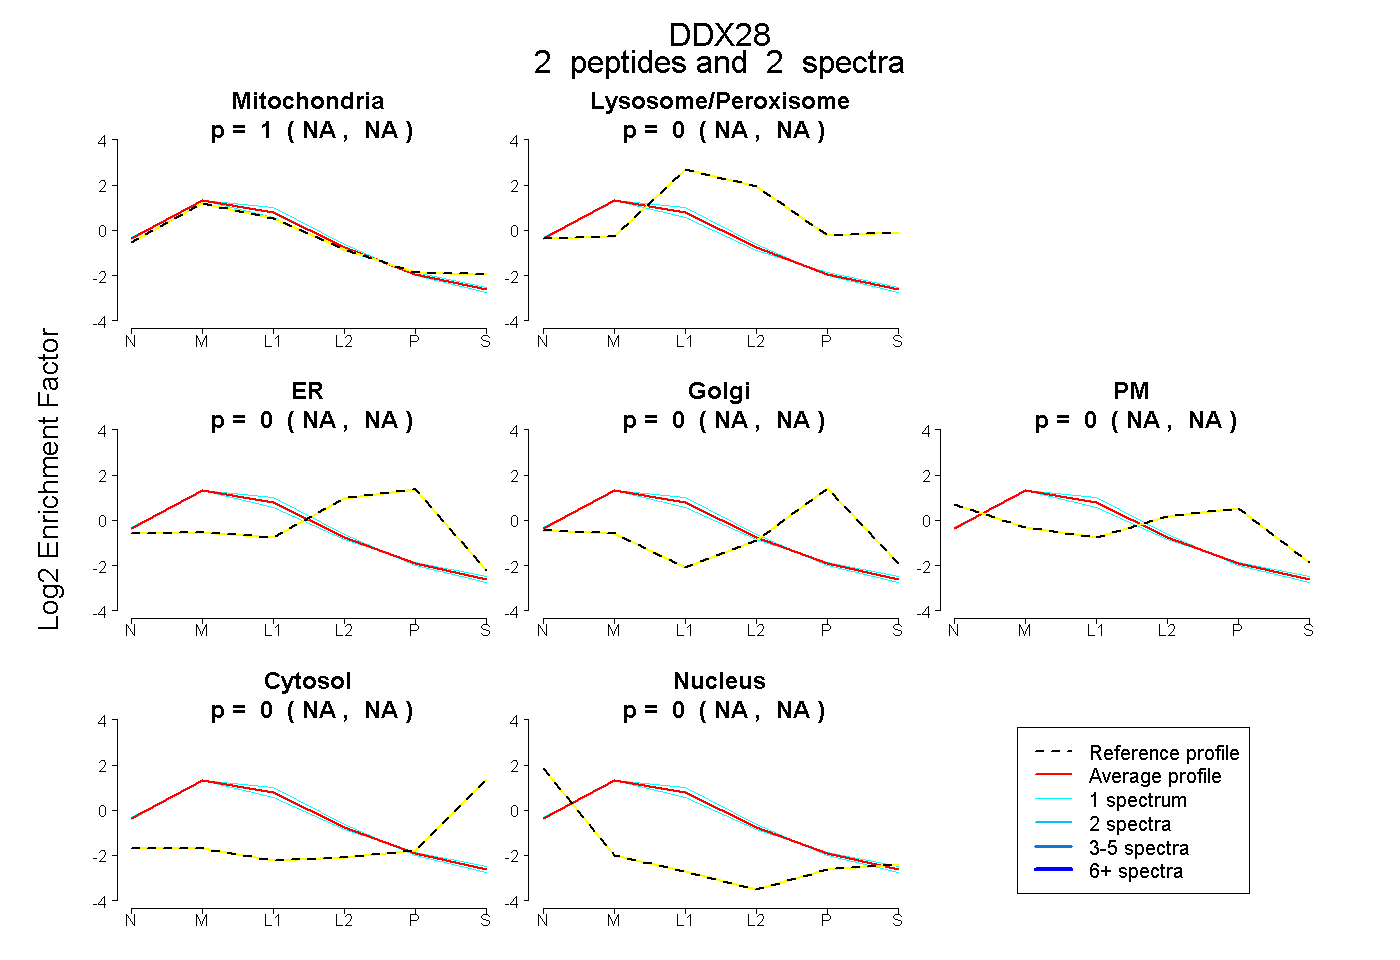 |
1.000 NA | NA |
0.000 NA | NA |
0.000 NA | NA |
0.000 NA | NA |
0.000 NA | NA |
0.000 NA | NA |
0.000 NA | NA |
|||
| Plot | Lyso | Other | |||||||||||
| Expt C |
11 peptides |
23 spectra |
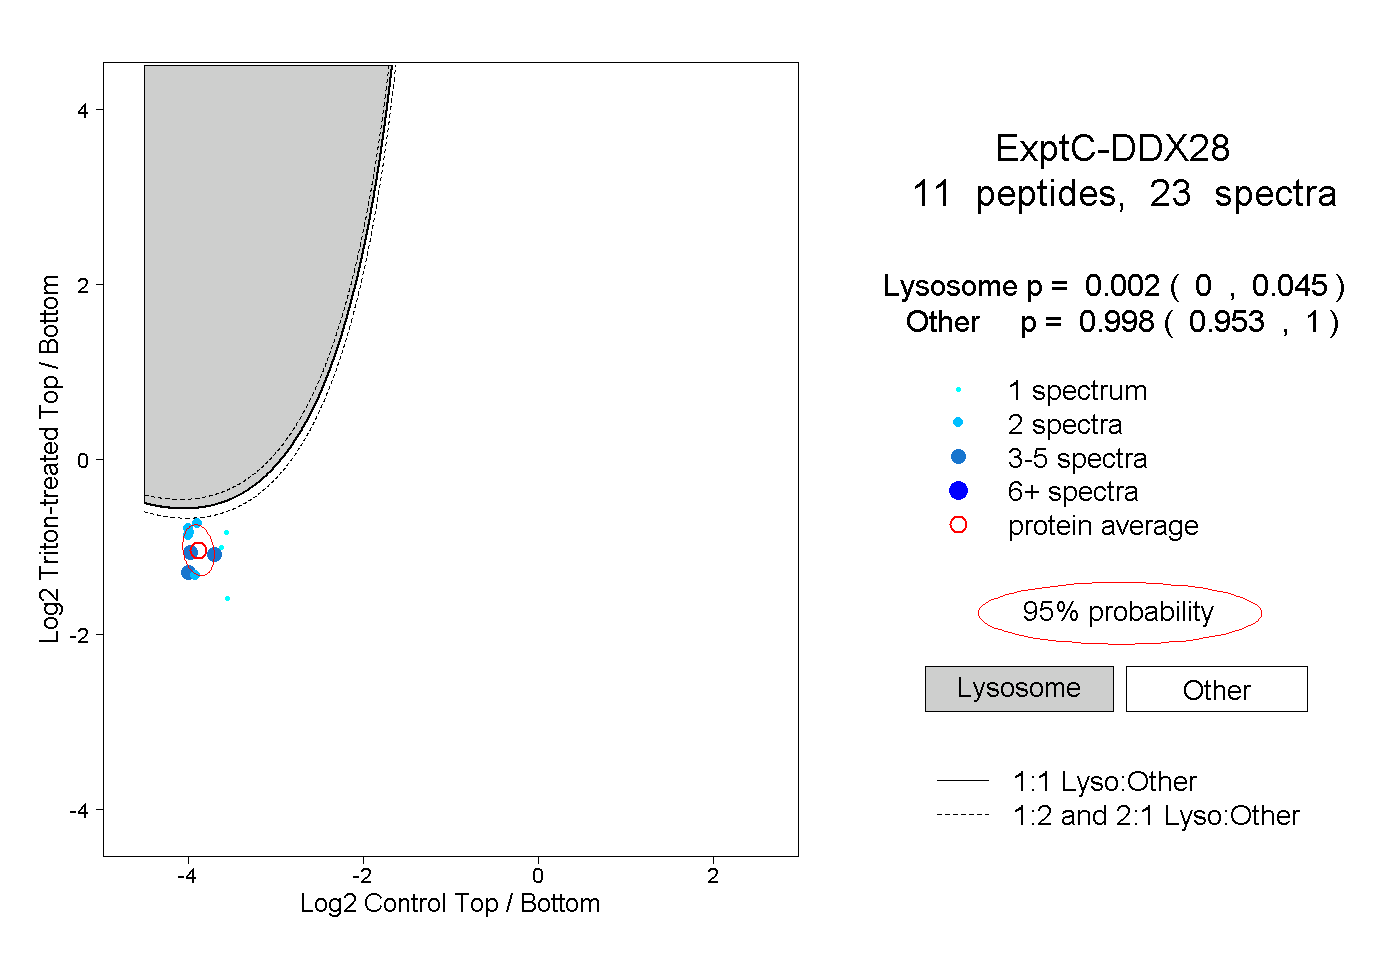 |
0.002 0.000 | 0.045 |
0.998 0.953 | 1.000 |