13
13peptides
spectra
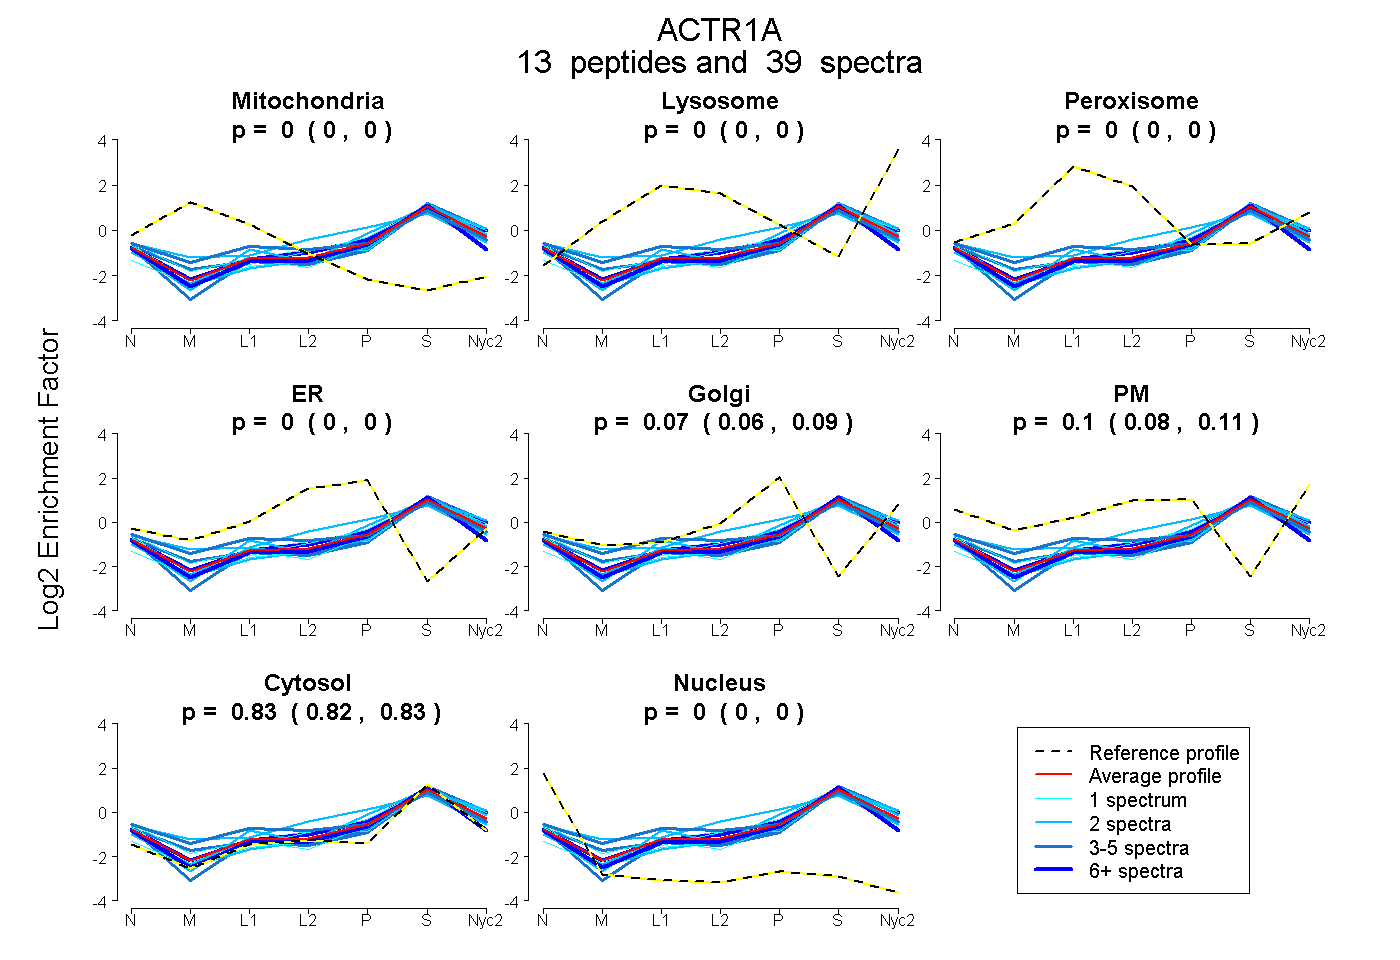
0.000 | 0.000
0.000 | 0.000
0.000 | 0.000
0.000 | 0.000
0.063 | 0.085
0.084 | 0.107
0.824 | 0.832
0.000 | 0.000
5peptides
spectra
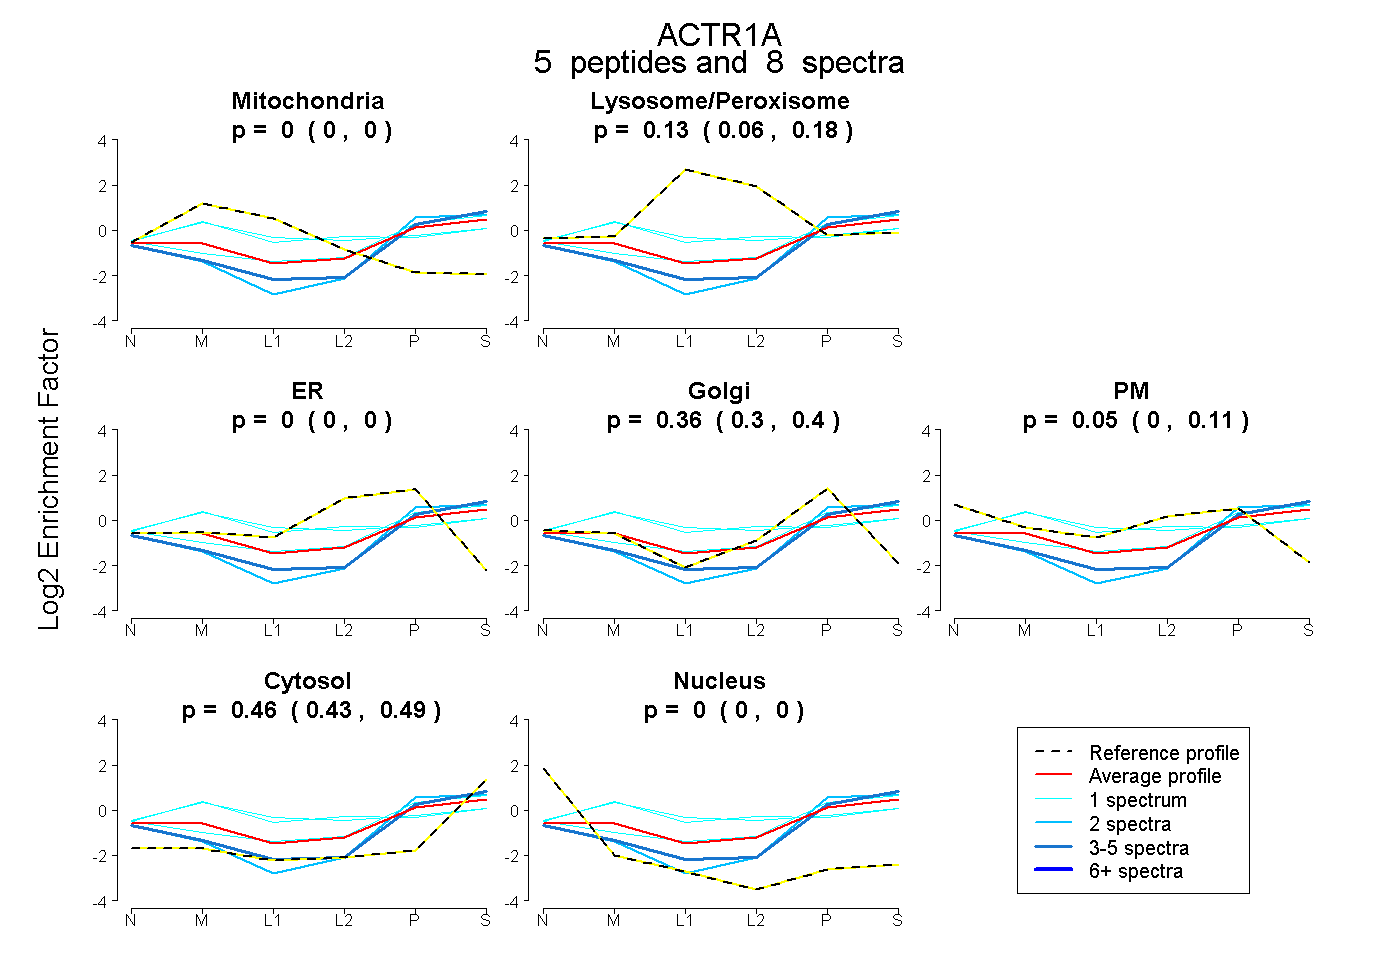
0.000 | 0.000
0.063 | 0.176
0.000 | 0.000
0.299 | 0.402
0.000 | 0.114
0.426 | 0.491
0.000 | 0.000