20
20peptides
spectra
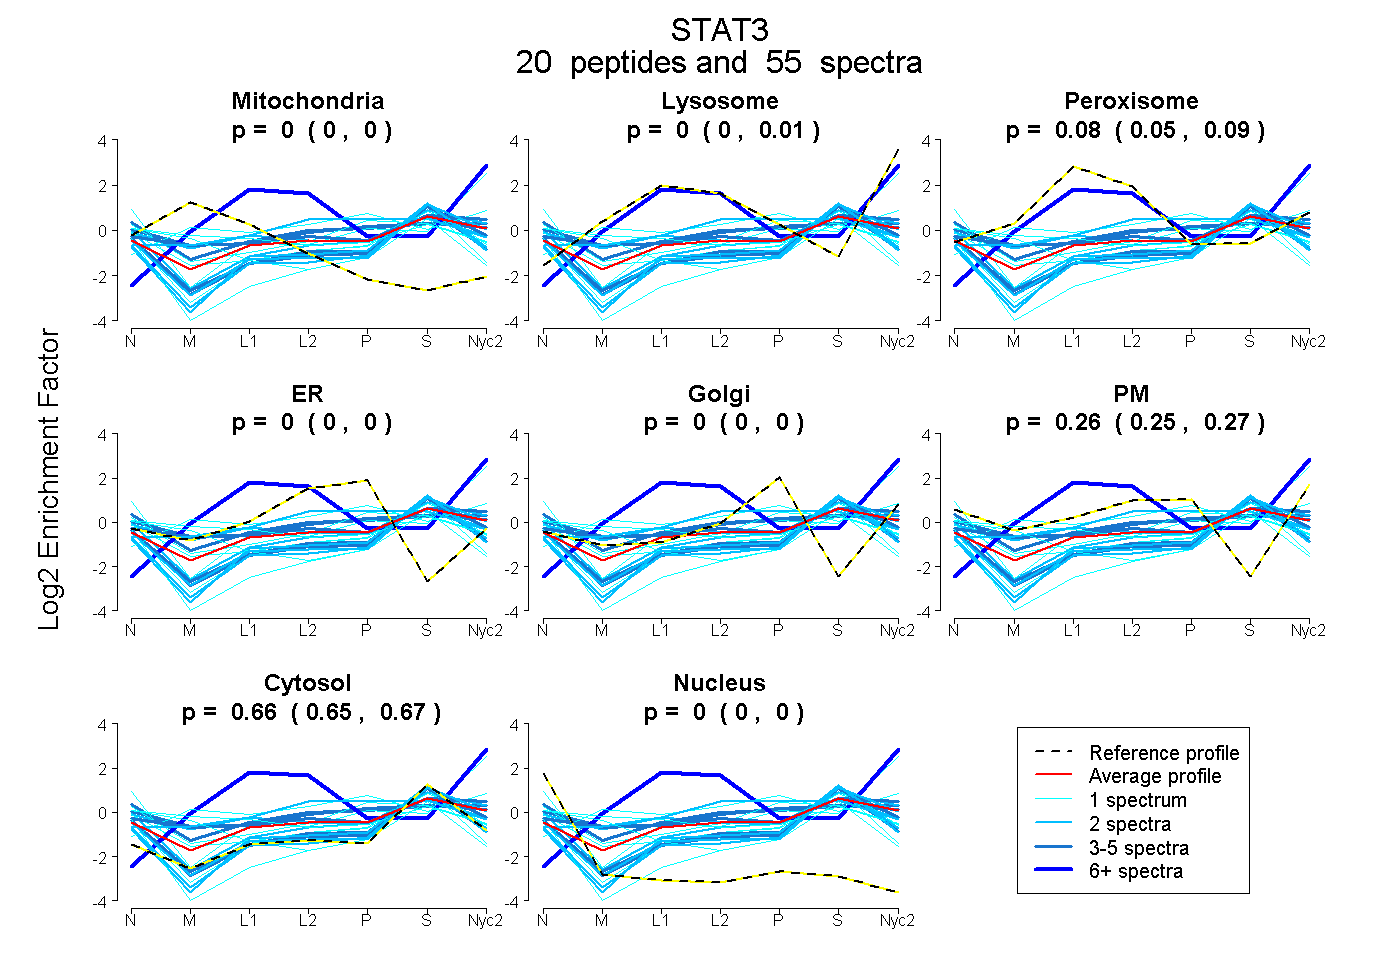
0.000 | 0.000
0.000 | 0.010
0.055 | 0.091
0.000 | 0.000
0.000 | 0.000
0.247 | 0.273
0.652 | 0.671
0.000 | 0.000
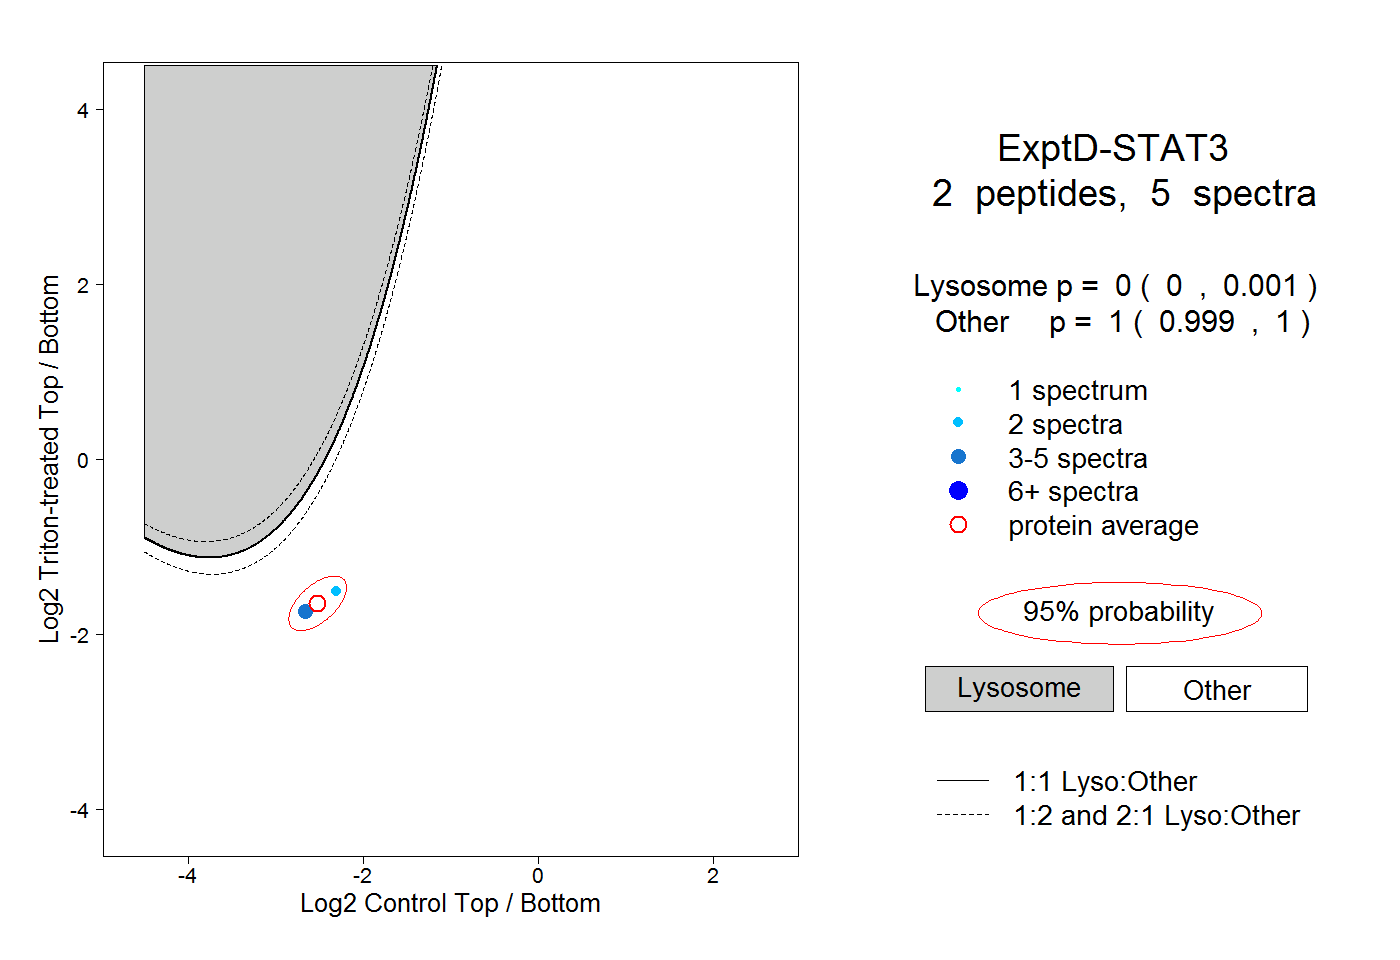
2peptides
spectra

0.000 | 0.000
0.000 | 0.000
0.000 | 0.000
0.000 | 0.000
0.071 | 0.101
0.750 | 0.759
0.144 | 0.168
17peptides
spectra
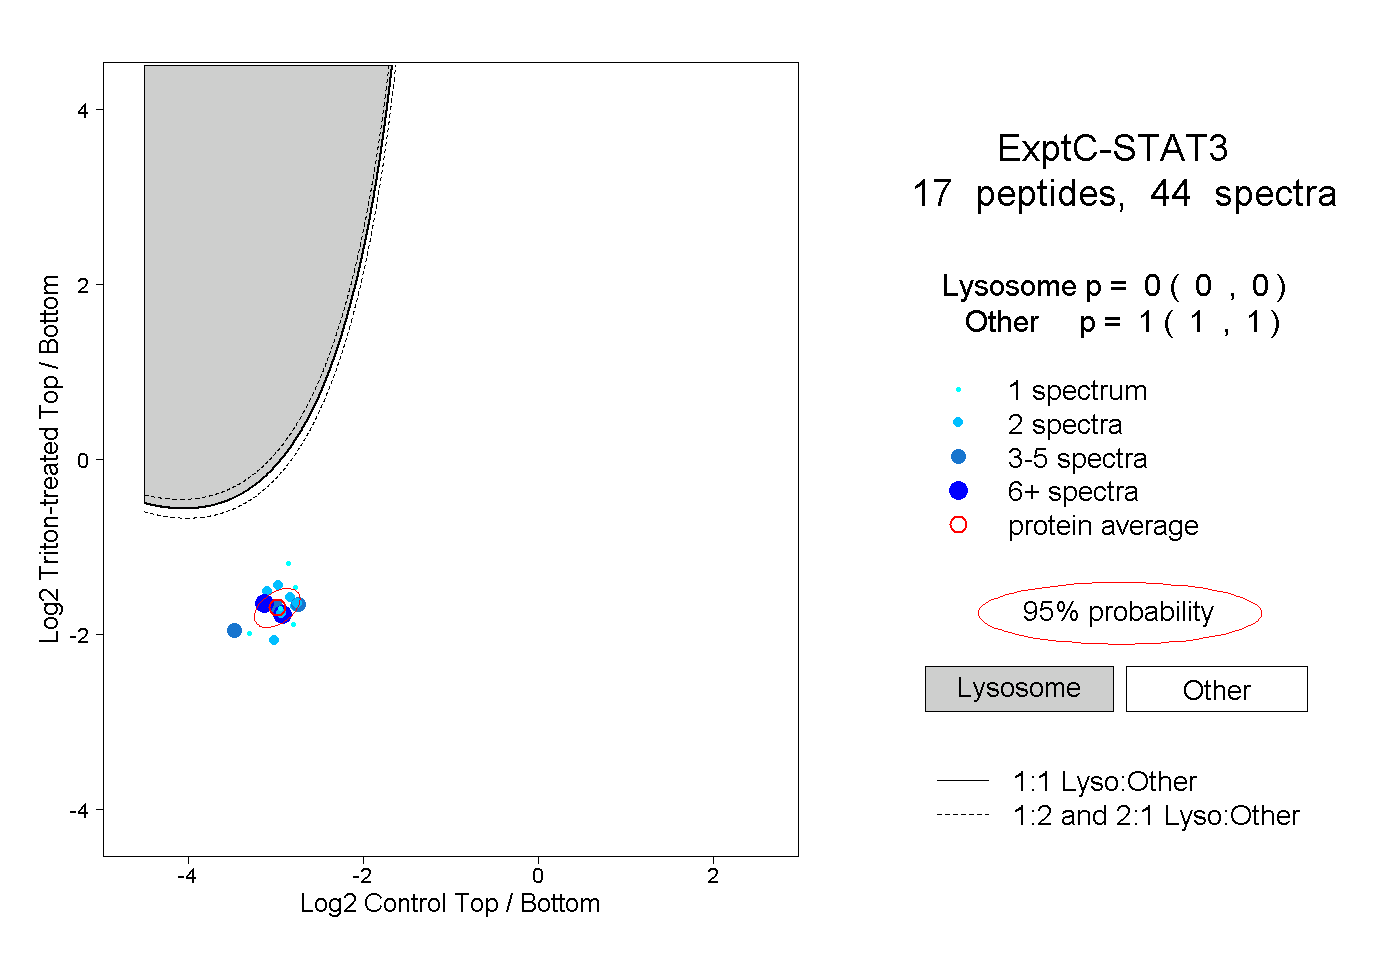
0.000 | 0.000
1.000 | 1.000