 20
20peptides
spectra
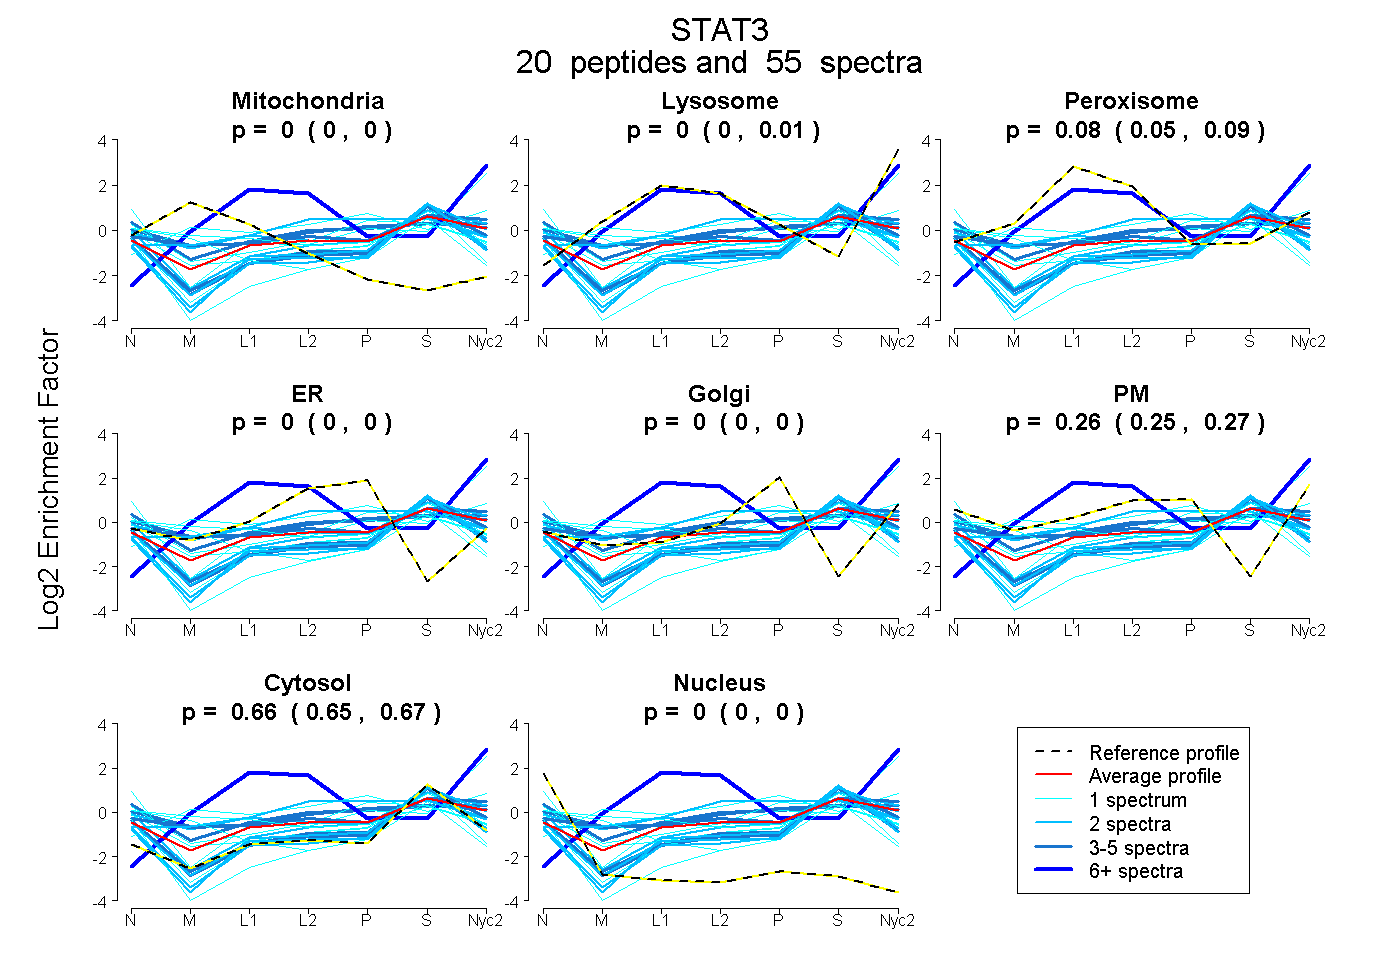
0.000 | 0.000
0.000 | 0.010
0.055 | 0.091
0.000 | 0.000
0.000 | 0.000
0.247 | 0.273
0.652 | 0.671
0.000 | 0.000
| Plot | Mito | Lyso | Perox | ER | Golgi | PM | Cytosol | Nucleus | |||||
| Expt A |
20 peptides |
55 spectra |
|
0.000 0.000 | 0.000 |
0.000 0.000 | 0.010 |
0.076 0.055 | 0.091 |
0.000 0.000 | 0.000 |
0.000 0.000 | 0.000 |
0.262 0.247 | 0.273 |
0.662 0.652 | 0.671 |
0.000 0.000 | 0.000 |
| 1 spectrum, TGVQFTTK | 0.222 | 0.000 | 0.117 | 0.000 | 0.000 | 0.198 | 0.462 | 0.000 | ||
| 3 spectra, AILSTKPPGTFLLR | 0.000 | 0.000 | 0.000 | 0.000 | 0.000 | 0.071 | 0.853 | 0.076 | ||
| 1 spectrum, LEELQQK | 0.000 | 0.000 | 0.000 | 0.128 | 0.090 | 0.209 | 0.543 | 0.030 | ||
| 1 spectrum, FSESSK | 0.000 | 0.000 | 0.000 | 0.000 | 0.000 | 0.247 | 0.727 | 0.026 | ||
| 1 spectrum, VQDLEQK | 0.345 | 0.000 | 0.000 | 0.000 | 0.000 | 0.000 | 0.591 | 0.064 | ||
| 3 spectra, GDPIVQHRPMLEER | 0.001 | 0.000 | 0.097 | 0.000 | 0.004 | 0.405 | 0.492 | 0.000 | ||
| 3 spectra, FLQESNVLYQHNLR | 0.000 | 0.000 | 0.068 | 0.000 | 0.000 | 0.433 | 0.499 | 0.000 | ||
| 1 spectrum, LVDFLR | 0.000 | 0.036 | 0.000 | 0.000 | 0.000 | 0.542 | 0.422 | 0.000 | ||
| 2 spectra, CLWEESR | 0.072 | 0.000 | 0.201 | 0.000 | 0.000 | 0.174 | 0.553 | 0.000 | ||
| 1 spectrum, QQIACIGGPPNICLDR | 0.001 | 0.269 | 0.144 | 0.000 | 0.295 | 0.000 | 0.291 | 0.000 | ||
| 2 spectra, FNILGTNTK | 0.000 | 0.000 | 0.000 | 0.000 | 0.000 | 0.261 | 0.739 | 0.000 | ||
| 4 spectra, QFLQSR | 0.000 | 0.000 | 0.000 | 0.000 | 0.000 | 0.138 | 0.845 | 0.017 | ||
| 4 spectra, QQMLEQHLQDVR | 0.001 | 0.075 | 0.113 | 0.000 | 0.000 | 0.250 | 0.560 | 0.000 | ||
| 2 spectra, QPCMPMHPDRPLVIK | 0.000 | 0.000 | 0.000 | 0.036 | 0.000 | 0.000 | 0.939 | 0.025 | ||
| 2 spectra, VVENLQDDFDFNYK | 0.000 | 0.000 | 0.000 | 0.000 | 0.000 | 0.109 | 0.885 | 0.006 | ||
| 1 spectrum, LLGPGVNYSGCQITWAK | 0.000 | 0.000 | 0.000 | 0.078 | 0.000 | 0.000 | 0.830 | 0.093 | ||
| 18 spectra, LVDIFR | 0.000 | 0.829 | 0.040 | 0.000 | 0.000 | 0.000 | 0.131 | 0.000 | ||
| 1 spectrum, TLTDEELADWK | 0.000 | 0.000 | 0.000 | 0.000 | 0.000 | 0.000 | 0.864 | 0.136 | ||
| 2 spectra, TQIQSVEPYTK | 0.000 | 0.000 | 0.256 | 0.247 | 0.054 | 0.000 | 0.443 | 0.000 | ||
| 2 spectra, YLEKPMEIAR | 0.000 | 0.000 | 0.000 | 0.000 | 0.004 | 0.000 | 0.937 | 0.059 |
| Plot | Mito | Lyso or Perox | ER | Golgi | PM | Cytosol | Nucleus | ||||||
| Expt B |
2 peptides |
4 spectra |
 |
0.000 0.000 | 0.000 |
0.000 0.000 | 0.000 |
0.000 0.000 | 0.000 |
0.000 0.000 | 0.000 |
0.088 0.071 | 0.101 |
0.755 0.750 | 0.759 |
0.157 0.144 | 0.168 |
|||
| Plot | Lyso | Other | |||||||||||
| Expt C |
17 peptides |
44 spectra |
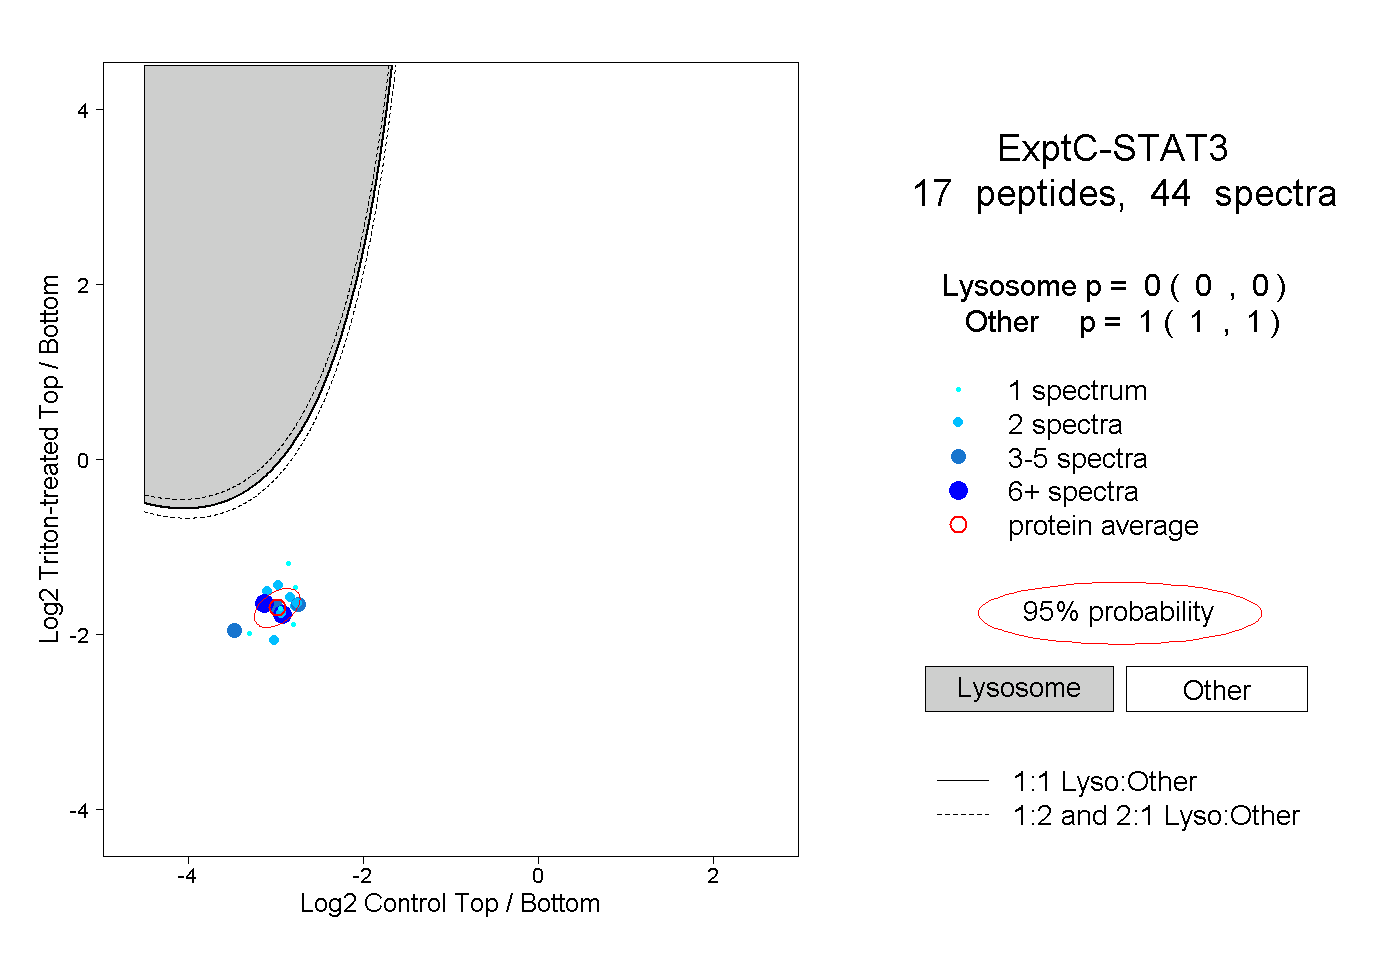 |
0.000 0.000 | 0.000 |
1.000 1.000 | 1.000 |
||||||||
| Plot | Lyso | Other | |||||||||||
| Expt D |
2 peptides |
5 spectra |
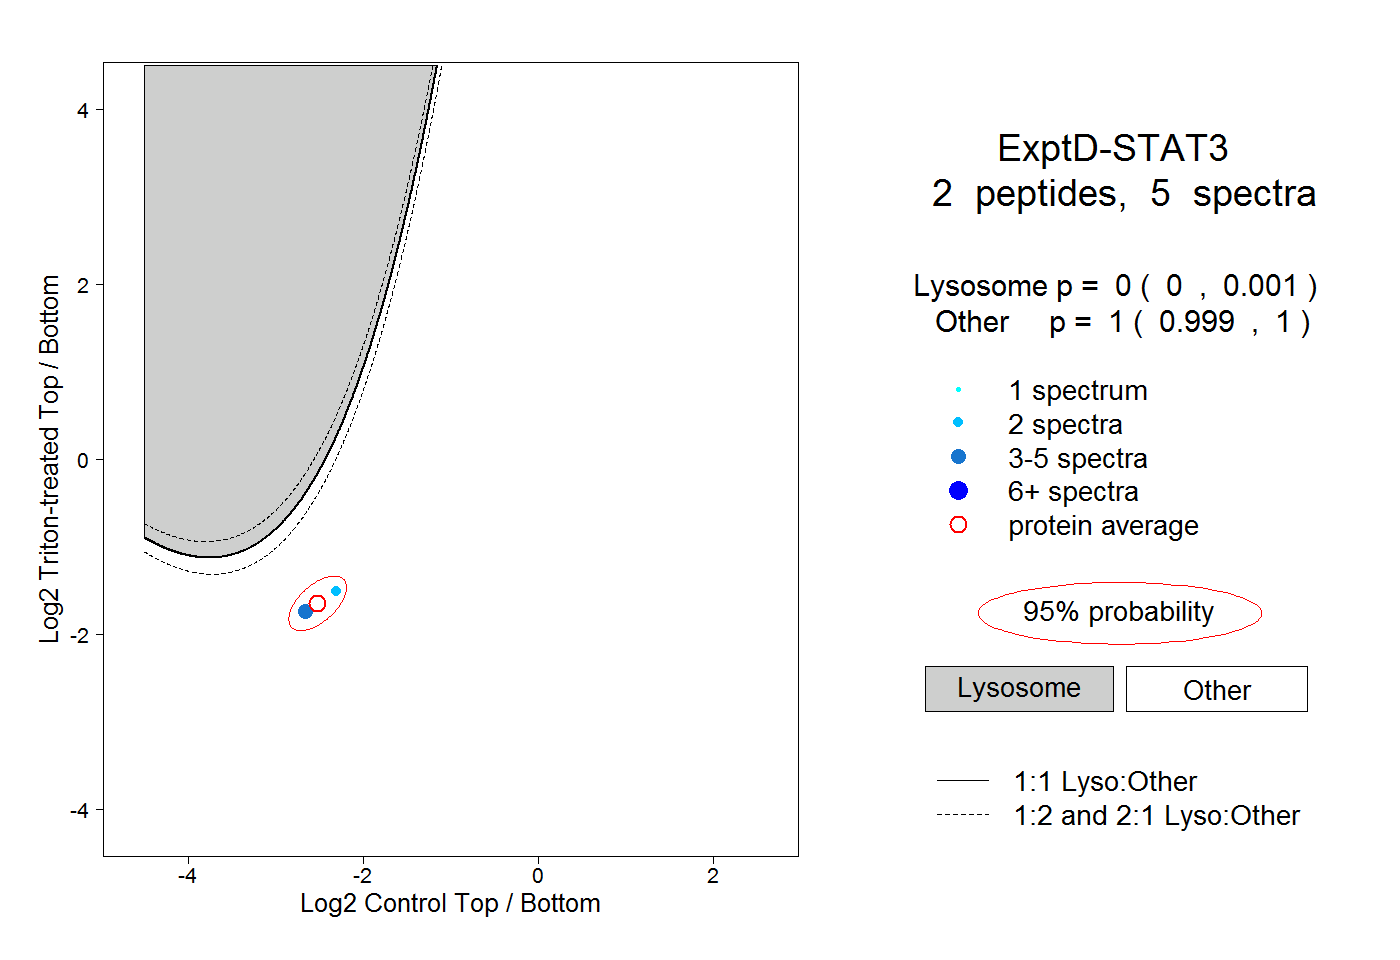 |
0.000 0.000 | 0.001 |
1.000 0.999 | 1.000 |