OXNAD1
[ENSRNOP00000026751]
Main page
| | | Plot |
Mito |
Lyso |
|
Perox |
ER |
Golgi |
PM |
Cytosol |
Nucleus |
|
| Expt A |
 5
5
peptides |
12
spectra |
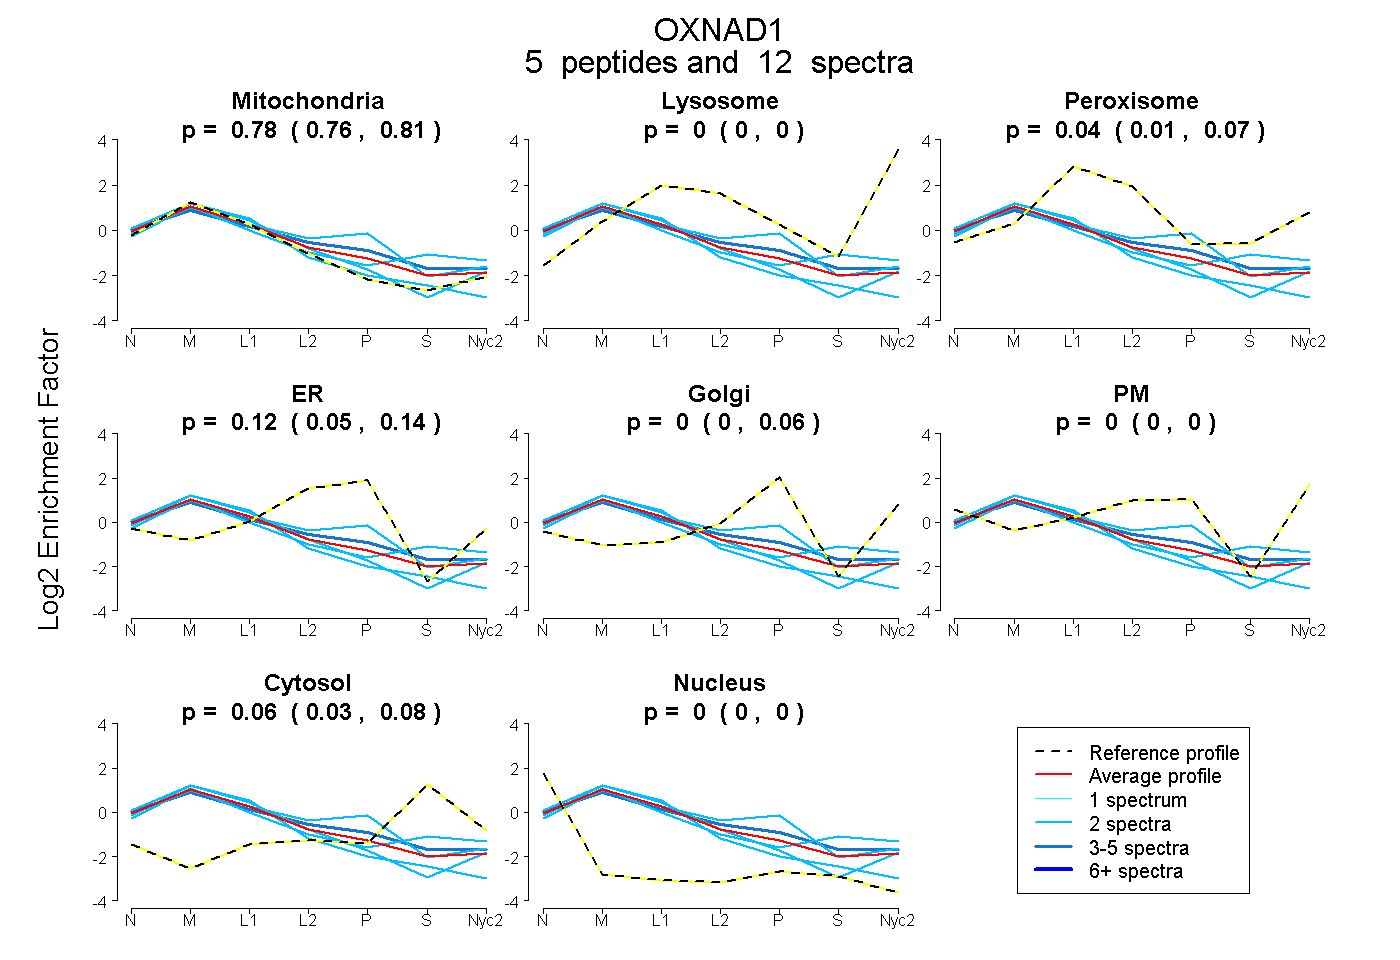 |
0.785
0.756 | 0.810 |
0.000
0.000 | 0.000 |
|
0.039
0.014 | 0.067 |
0.117
0.047 | 0.143 |
0.000
0.000 | 0.059 |
0.000
0.000 | 0.000 |
0.058
0.030 | 0.076 |
0.000
0.000 | 0.000 |
|
| | | Plot |
Mito |
|
Lyso or Perox |
|
ER |
Golgi |
PM |
Cytosol |
Nucleus |
|
| Expt B |
4
peptides |
7
spectra |
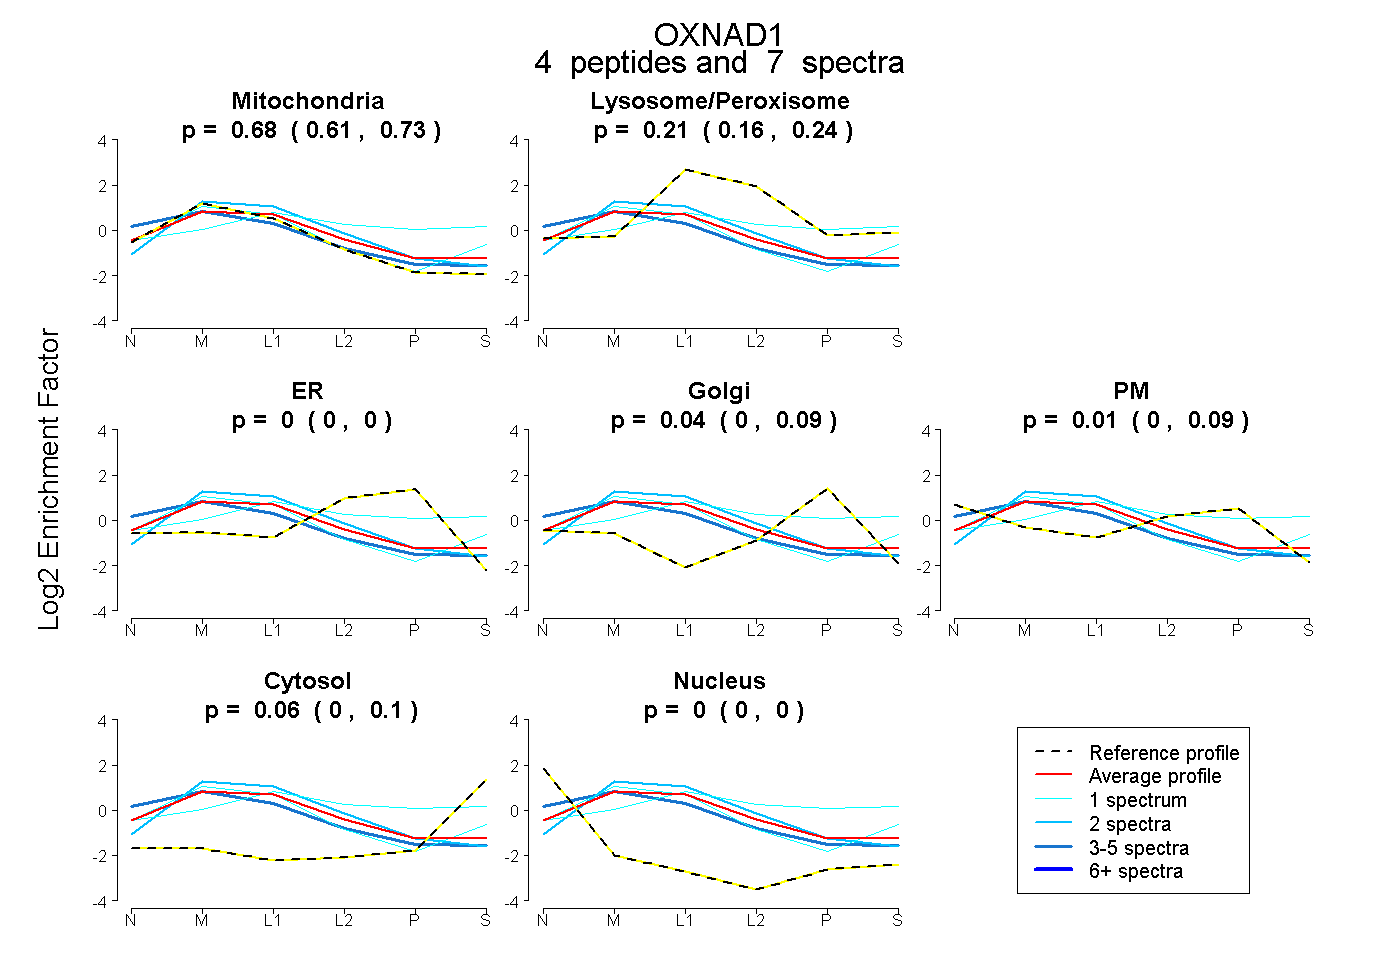 |
0.681
0.605 | 0.733 |
|
0.210
0.155 | 0.244 |
|
0.000
0.000 | 0.000 |
0.044
0.000 | 0.090 |
0.009
0.000 | 0.093 |
0.057
0.005 | 0.101 |
0.000
0.000 | 0.003 |
|
| 3 spectra, CTLDSEVALR |
0.703 |
|
0.094 |
|
0.000 |
0.000 |
0.106 |
0.000 |
0.097 |
|
| 1 spectrum, IIELAVK |
0.056 |
|
0.569 |
|
0.000 |
0.196 |
0.000 |
0.180 |
0.000 |
|
| 1 spectrum, NILDLVHEFPEK |
0.713 |
|
0.144 |
|
0.000 |
0.000 |
0.000 |
0.143 |
0.000 |
|
| 2 spectra, EHICFEK |
0.767 |
|
0.209 |
|
0.024 |
0.000 |
0.000 |
0.000 |
0.000 |
|
| | | Plot |
|
Lyso |
|
|
|
|
|
|
|
Other |
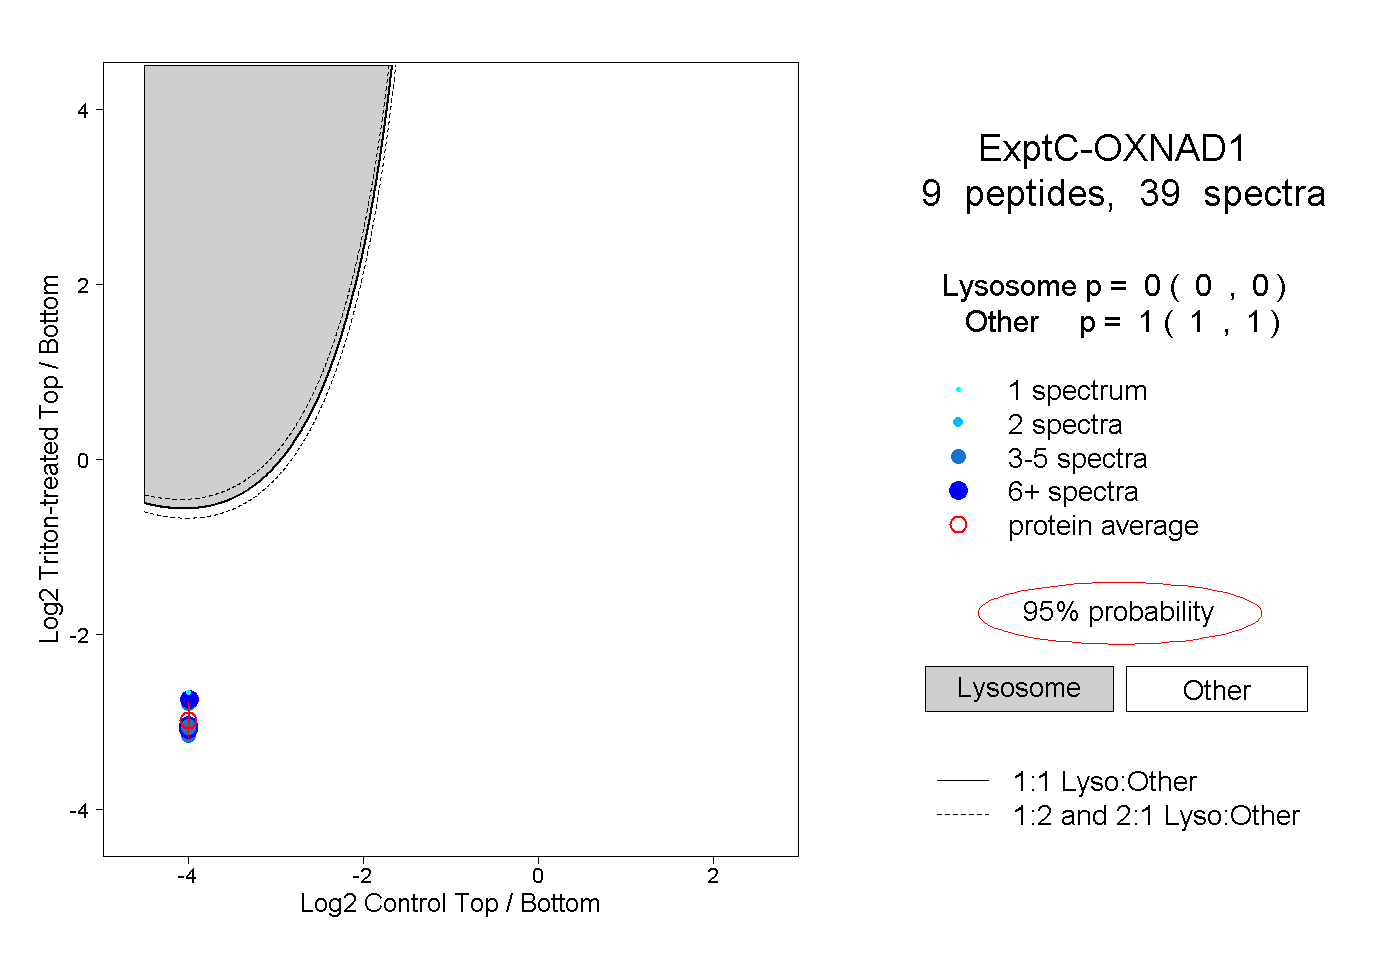
| Expt C |
9
peptides |
39
spectra |
 |
|
0.000
0.000 | 0.000 |
|
|
|
|
|
|
|
1.000
1.000 | 1.000 |
| | | Plot |
|
Lyso |
|
|
|
|
|
|
|
Other |
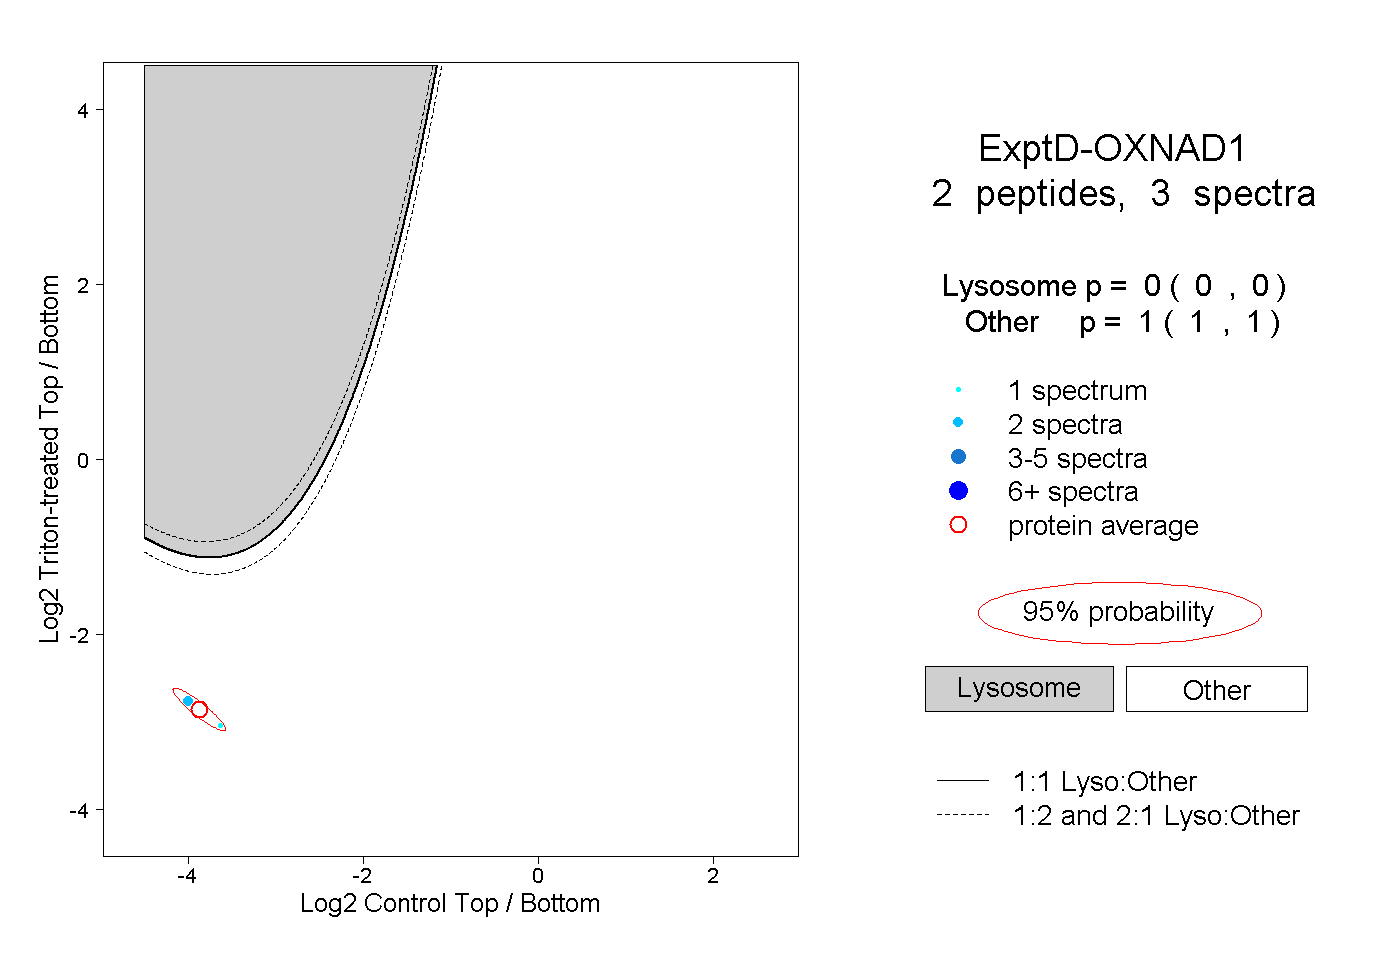
| Expt D |
2
peptides |
3
spectra |
 |
|
0.000
0.000 | 0.000 |
|
|
|
|
|
|
|
1.000
1.000 | 1.000 |