 10
10peptides
spectra
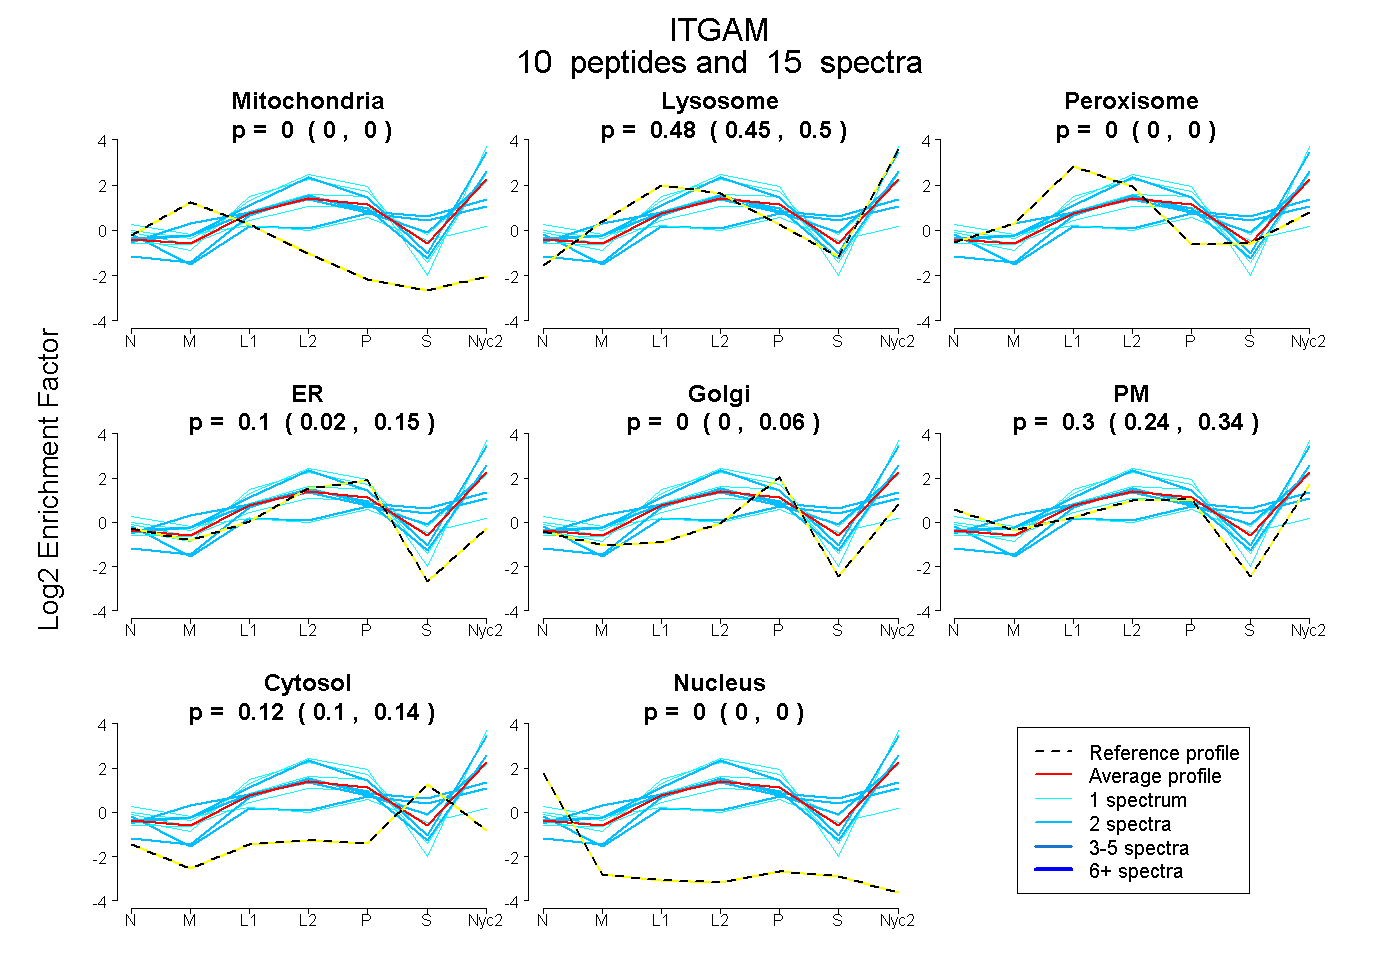
0.000 | 0.000
0.449 | 0.501
0.000 | 0.002
0.021 | 0.153
0.000 | 0.060
0.236 | 0.335
0.102 | 0.138
0.000 | 0.000
1peptide
spectrum
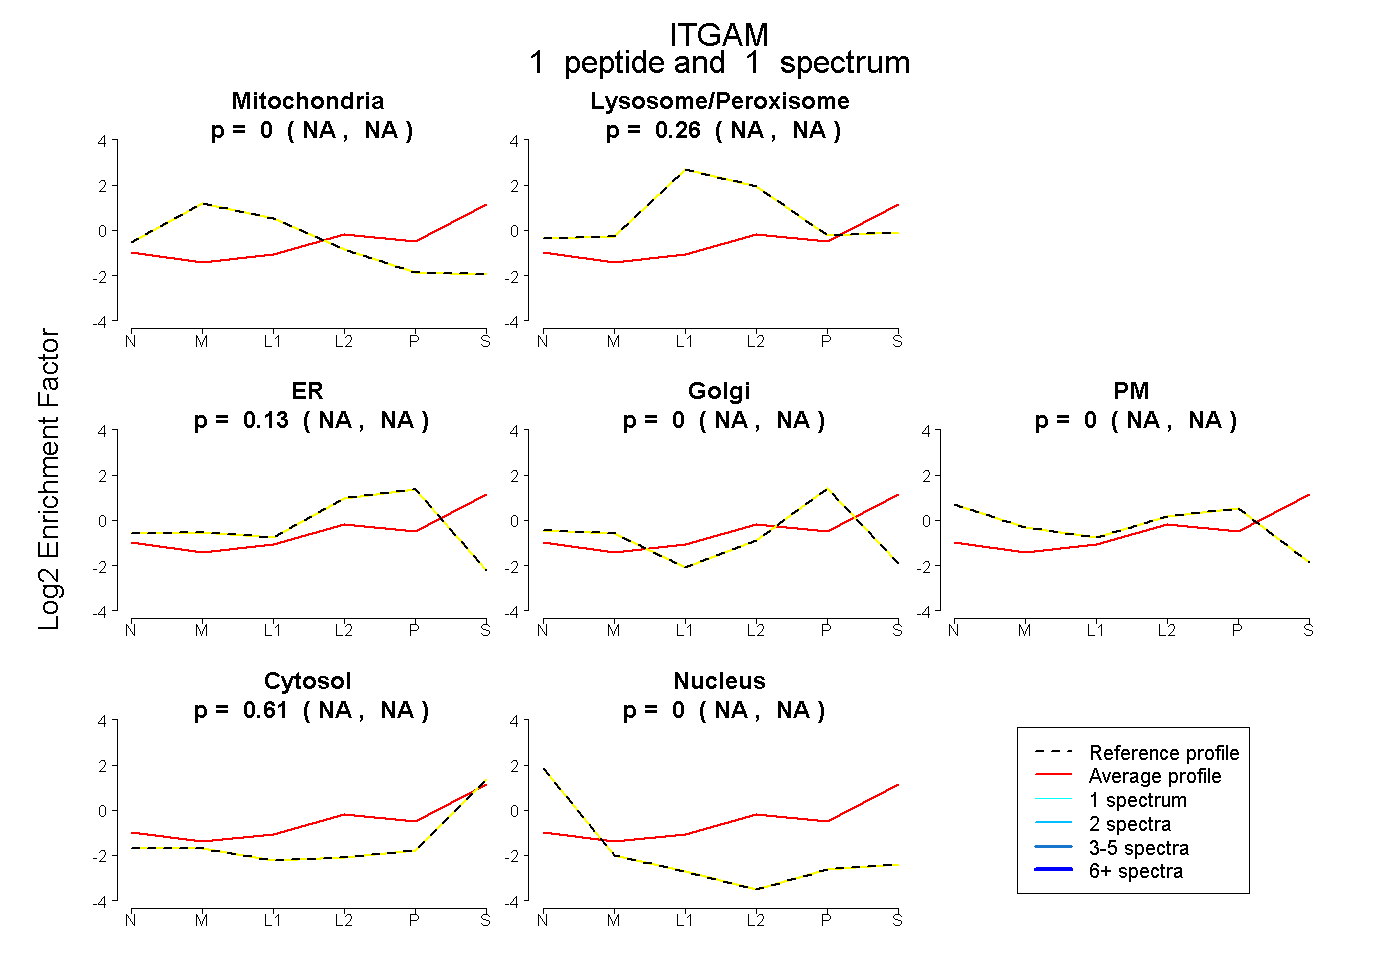
NA | NA
NA | NA
NA | NA
NA | NA
NA | NA
NA | NA
NA | NA
15peptides
spectra
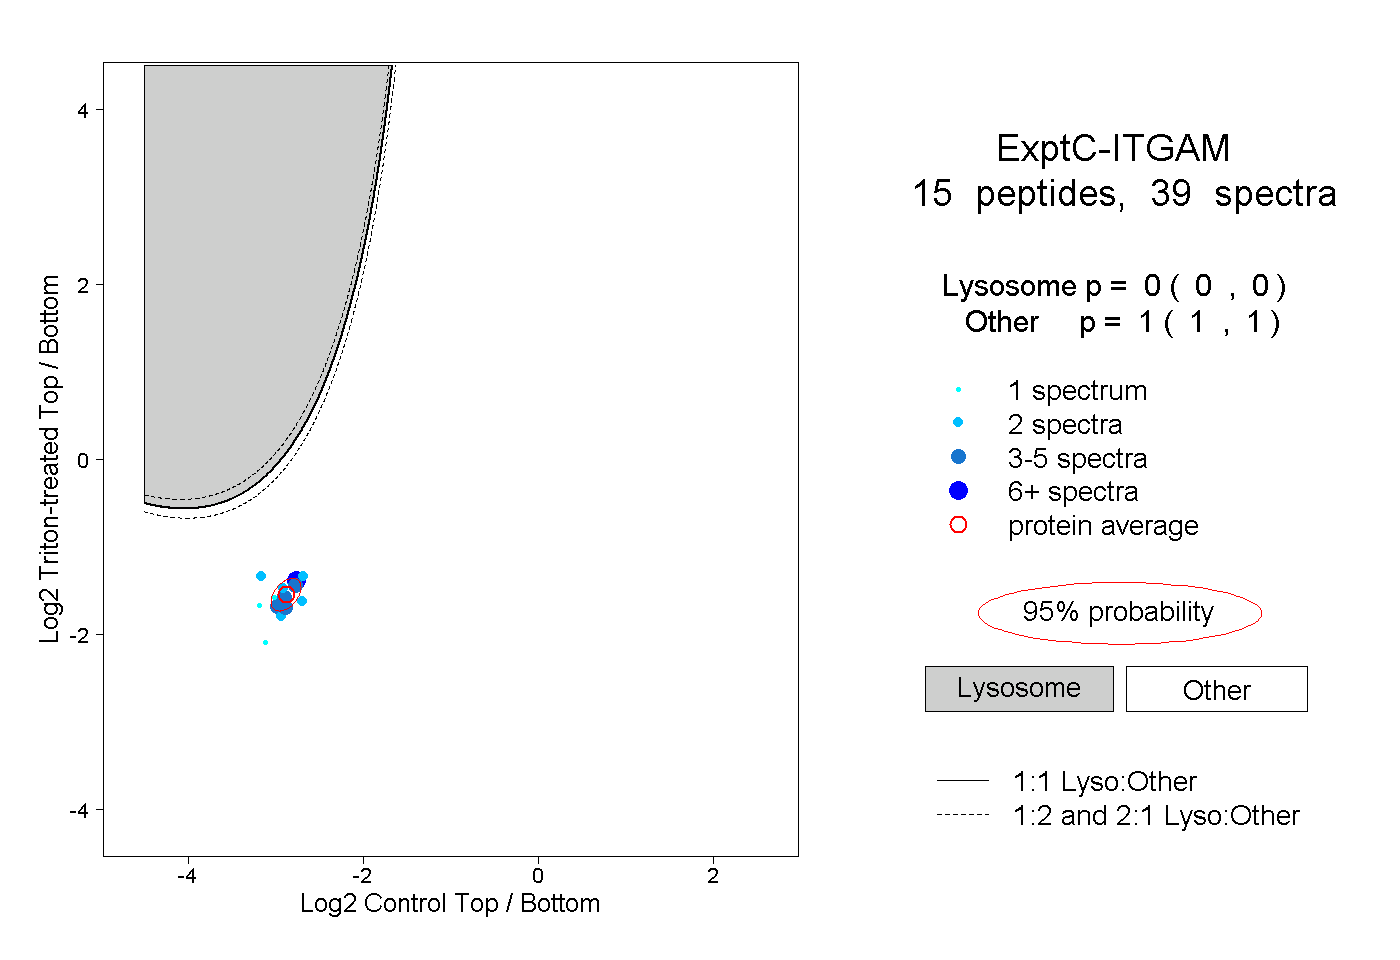
0.000 | 0.000
1.000 | 1.000
3peptides
spectra
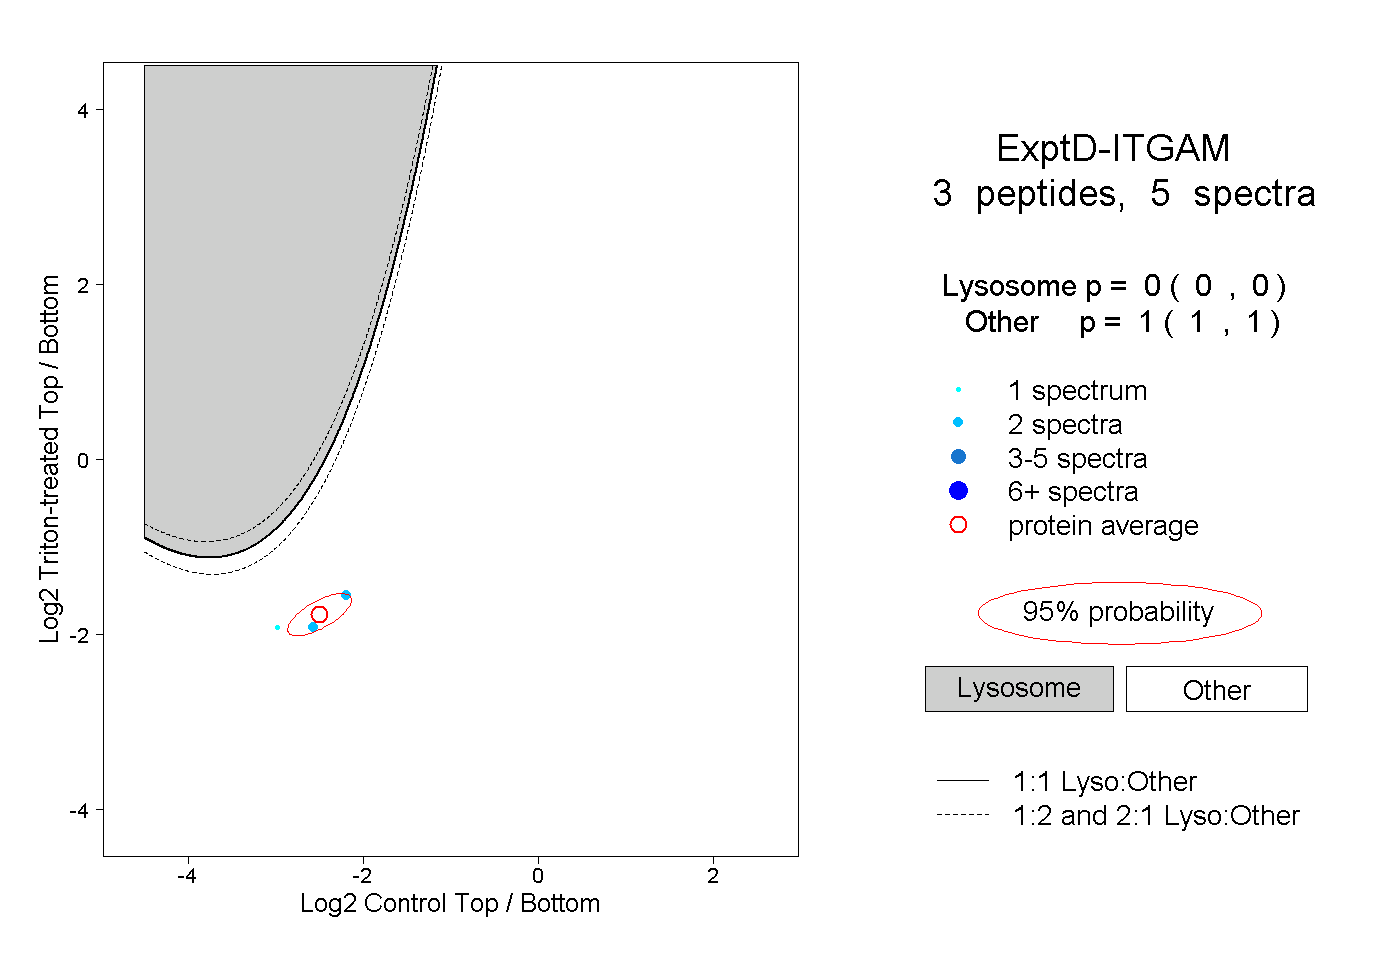
0.000 | 0.000
1.000 | 1.000