 7
7peptides
spectra
0.000 | 0.000
0.318 | 0.382
0.000 | 0.000
0.029 | 0.124
0.036 | 0.127
0.421 | 0.535
0.000 | 0.000
0.000 | 0.000
10peptides
spectra
0.000 | 0.001
0.999 | 1.000
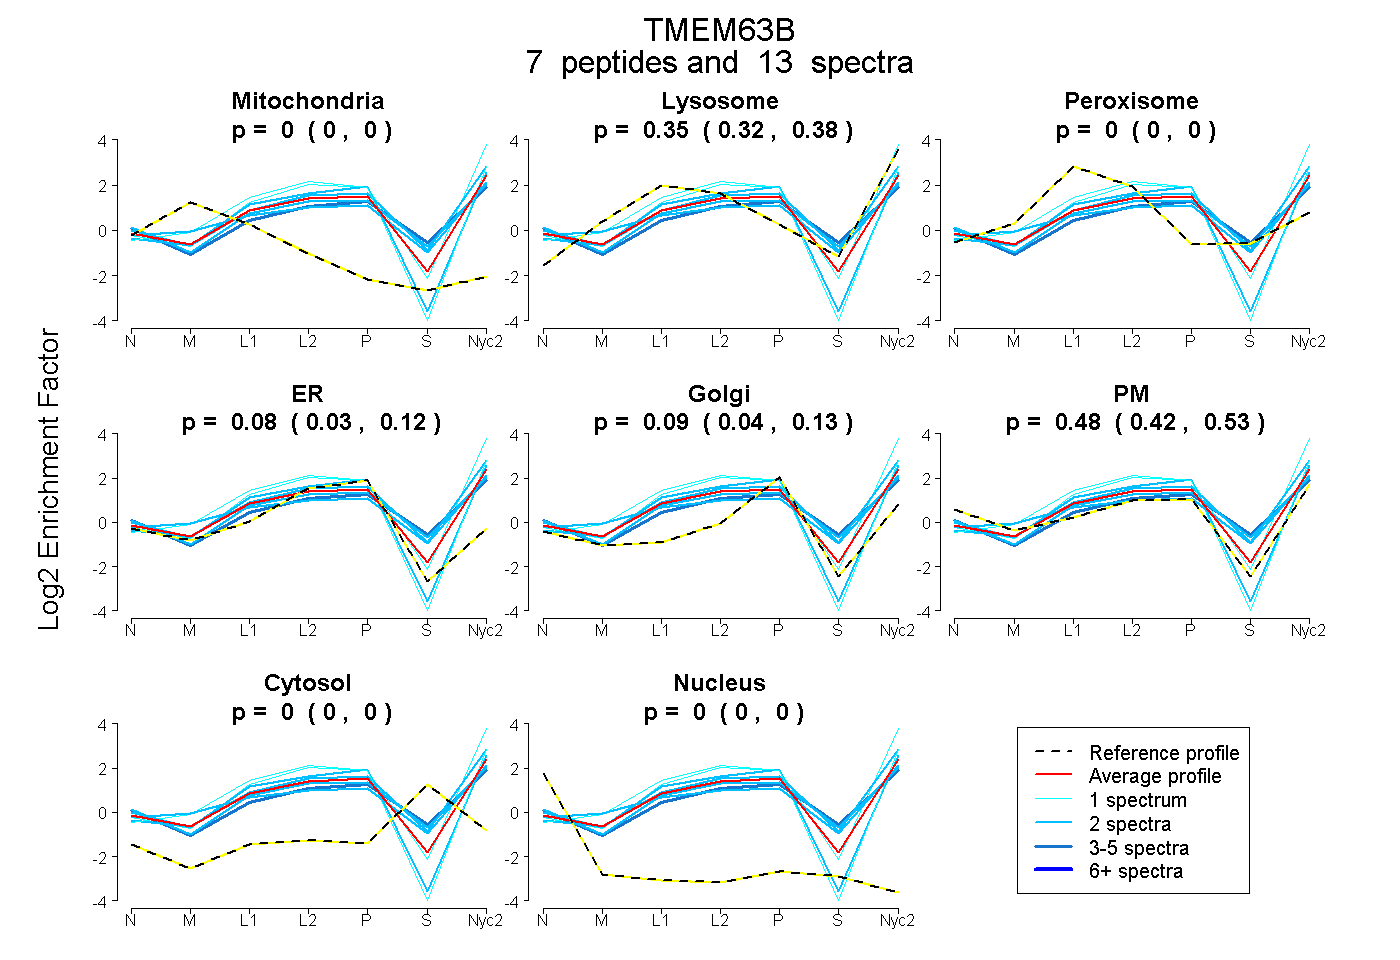
| Plot | Mito | Lyso | Perox | ER | Golgi | PM | Cytosol | Nucleus | |||||
| Expt A |
7 peptides |
13 spectra |
|
0.000 0.000 | 0.000 |
0.352 0.318 | 0.382 |
0.000 0.000 | 0.000 |
0.081 0.029 | 0.124 |
0.085 0.036 | 0.127 |
0.481 0.421 | 0.535 |
0.000 0.000 | 0.000 |
0.000 0.000 | 0.000 |
||
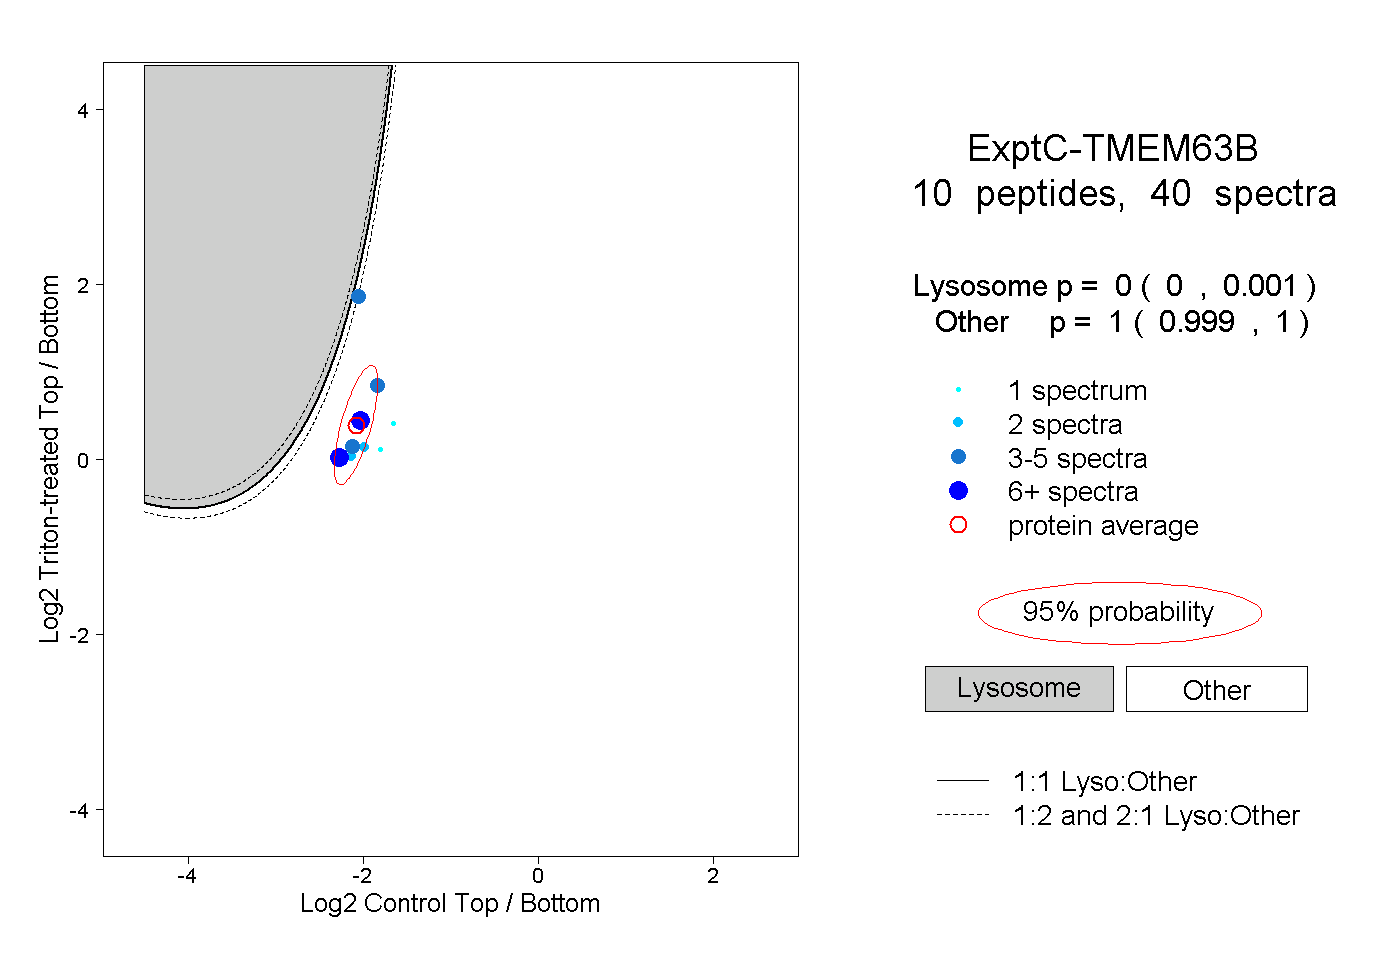
| Plot | Lyso | Other | |||||||||||
| Expt C |
10 peptides |
40 spectra |
|
0.000 0.000 | 0.001 |
1.000 0.999 | 1.000 |
| 2 spectra, LTSVSSSVDFDQR | 0.000 | 1.000 | ||||||||
| 1 spectrum, YNIYYAYLPAK | 0.000 | 1.000 | ||||||||
| 4 spectra, LYFTNLQSK | 0.000 | 1.000 | ||||||||
| 5 spectra, TTIANLK | 0.000 | 1.000 | ||||||||
| 3 spectra, WLFDK | 0.183 | 0.817 | ||||||||
| 6 spectra, TLFINGISK | 0.000 | 1.000 | ||||||||
| 2 spectra, FLAEAAIR | 0.000 | 1.000 | ||||||||
| 1 spectrum, IEHTETDAVSSR | 0.000 | 1.000 | ||||||||
| 5 spectra, LMFLDAER | 0.000 | 1.000 | ||||||||
| 11 spectra, YAESEK | 0.000 | 1.000 |
| Plot | Lyso | Other | |||||||||||
| Expt D |
1 peptide |
1 spectrum |
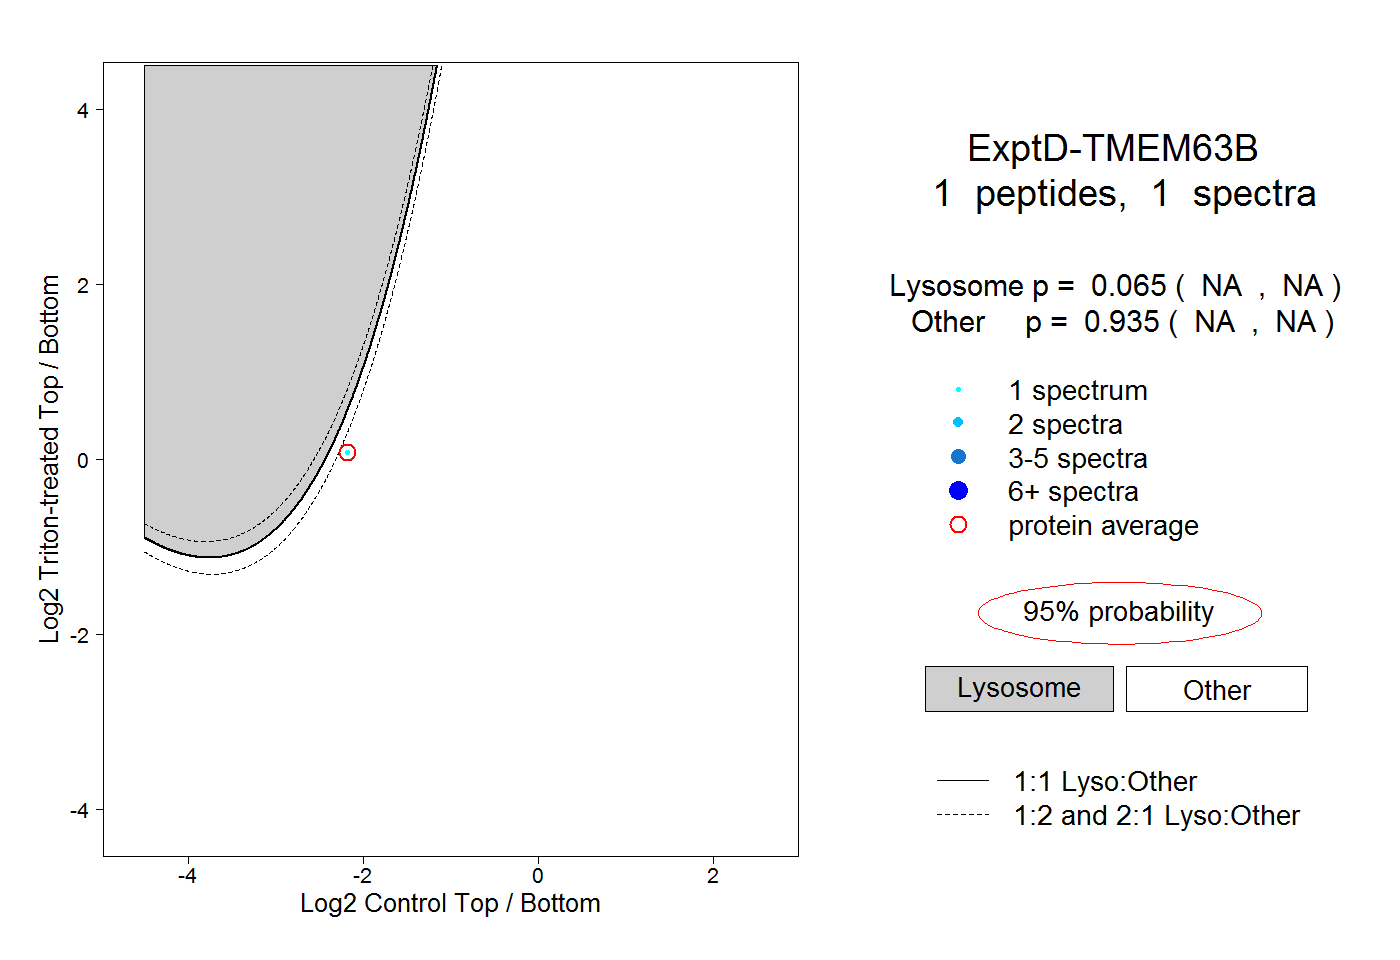 |
0.065 NA | NA |
0.935 NA | NA |