5
5peptides
spectra

0.000 | 0.000
0.000 | 0.000
0.157 | 0.202
0.000 | 0.188
0.000 | 0.123
0.390 | 0.508
0.179 | 0.219
0.000 | 0.000
7peptides
spectra
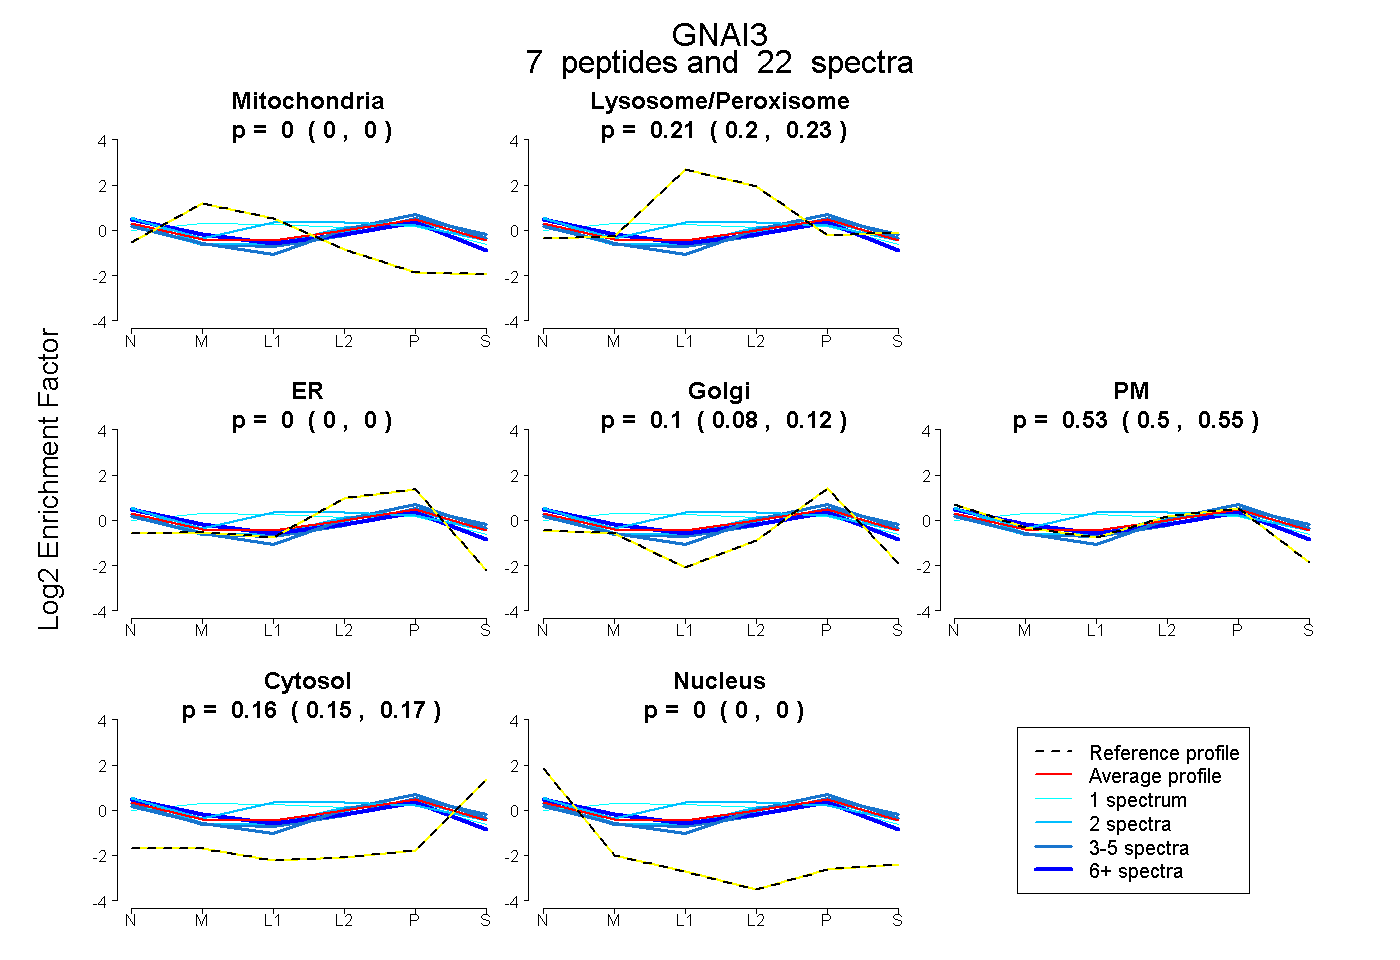
0.000 | 0.000
0.197 | 0.226
0.000 | 0.000
0.079 | 0.120
0.497 | 0.548
0.153 | 0.168
0.000 | 0.000