| 1 spectrum, NIYSEELR |
0.000 |
|
0.000 |
|
0.000 |
0.000 |
0.000 |
0.000 |
1.000 |
|
| 4 spectra, LADALQELR |
0.000 |
|
0.000 |
|
0.000 |
0.000 |
0.000 |
0.000 |
1.000 |
|
| 2 spectra, EDLQELNDR |
0.000 |
|
0.000 |
|
0.000 |
0.000 |
0.000 |
0.000 |
1.000 |
|
| 7 spectra, EGDLLAAQAR |
0.000 |
|
0.000 |
|
0.000 |
0.000 |
0.000 |
0.000 |
1.000 |
|
| 3 spectra, SLETENAGLR |
0.000 |
|
0.000 |
|
0.000 |
0.000 |
0.000 |
0.000 |
1.000 |
|
| 6 spectra, LSPSPTSQR |
0.000 |
|
0.000 |
|
0.000 |
0.000 |
0.000 |
0.000 |
1.000 |
|
| 3 spectra, AAYEAELGDAR |
0.000 |
|
0.000 |
|
0.000 |
0.000 |
0.000 |
0.000 |
1.000 |
|
| 4 spectra, NSNLVGAAHEELQQSR |
0.000 |
|
0.305 |
|
0.000 |
0.000 |
0.000 |
0.000 |
0.695 |
|
| 4 spectra, TLEGELHDLR |
0.000 |
|
0.000 |
|
0.000 |
0.000 |
0.000 |
0.000 |
1.000 |
|
| 1 spectrum, VAVEEVDEEGK |
0.000 |
|
0.000 |
|
0.000 |
0.000 |
0.000 |
0.000 |
1.000 |
|
| 8 spectra, ITESEEVVSR |
0.000 |
|
0.000 |
|
0.000 |
0.000 |
0.000 |
0.000 |
1.000 |
|
| 2 spectra, LAVYIDR |
0.000 |
|
0.000 |
|
0.000 |
0.000 |
0.000 |
0.000 |
1.000 |
|
| 1 spectrum, EAALSTALSEK |
0.000 |
|
0.000 |
|
0.000 |
0.000 |
0.000 |
0.000 |
1.000 |
|
| 1 spectrum, DLEDSLAR |
0.000 |
|
0.192 |
|
0.000 |
0.000 |
0.079 |
0.000 |
0.729 |
|
| 1 spectrum, TVLCGTCGQPADK |
0.111 |
|
0.105 |
|
0.000 |
0.000 |
0.073 |
0.000 |
0.712 |
|
| 1 spectrum, SVGGSGGGSFGDNLVTR |
0.278 |
|
0.192 |
|
0.000 |
0.000 |
0.000 |
0.000 |
0.531 |
|
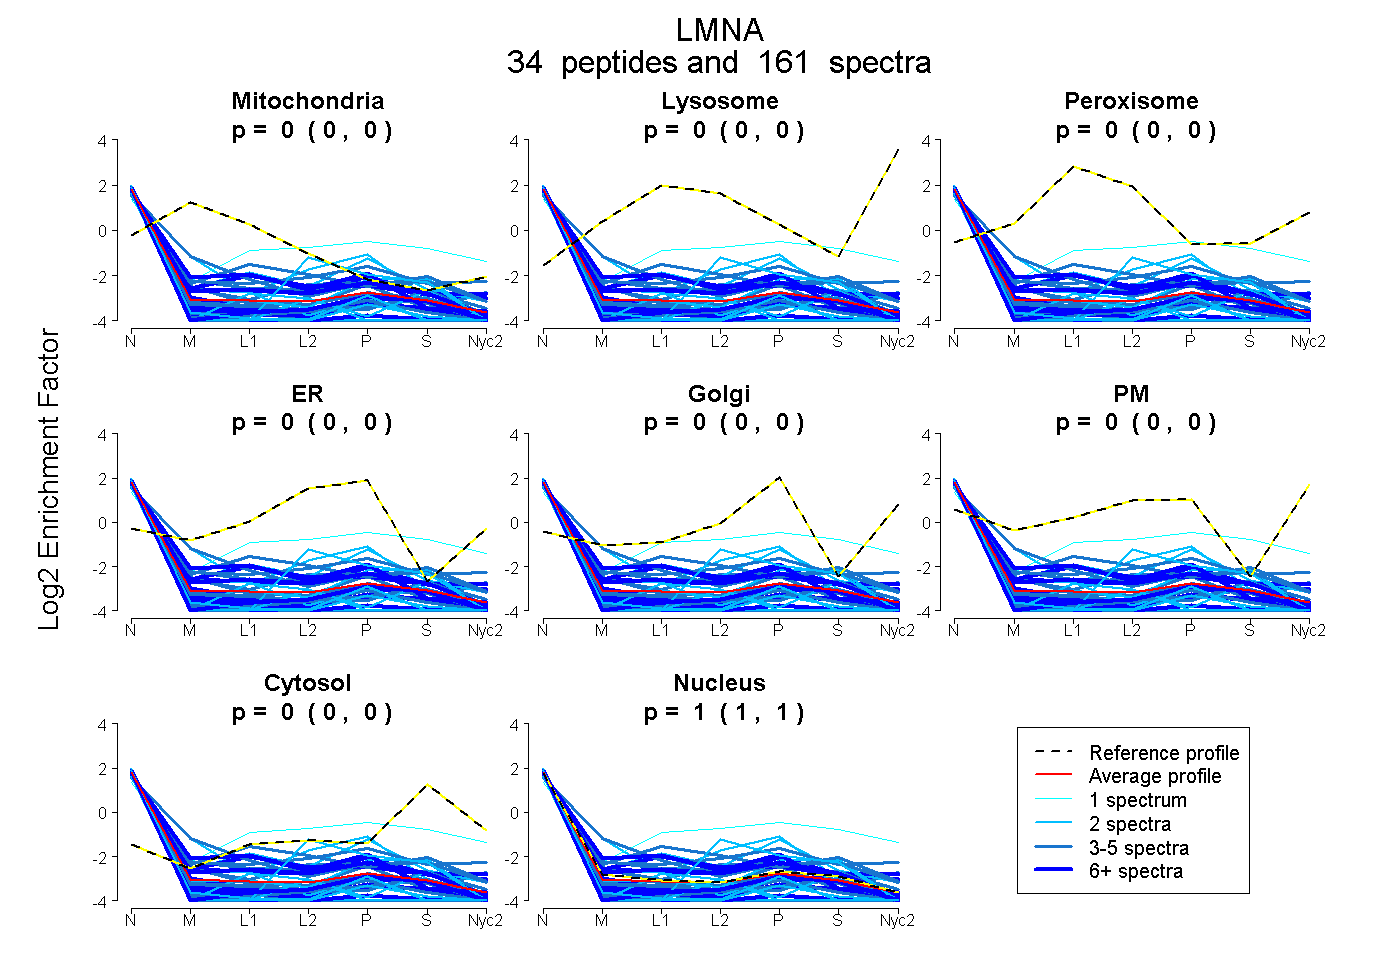
 34
34