 31
31peptides
spectra
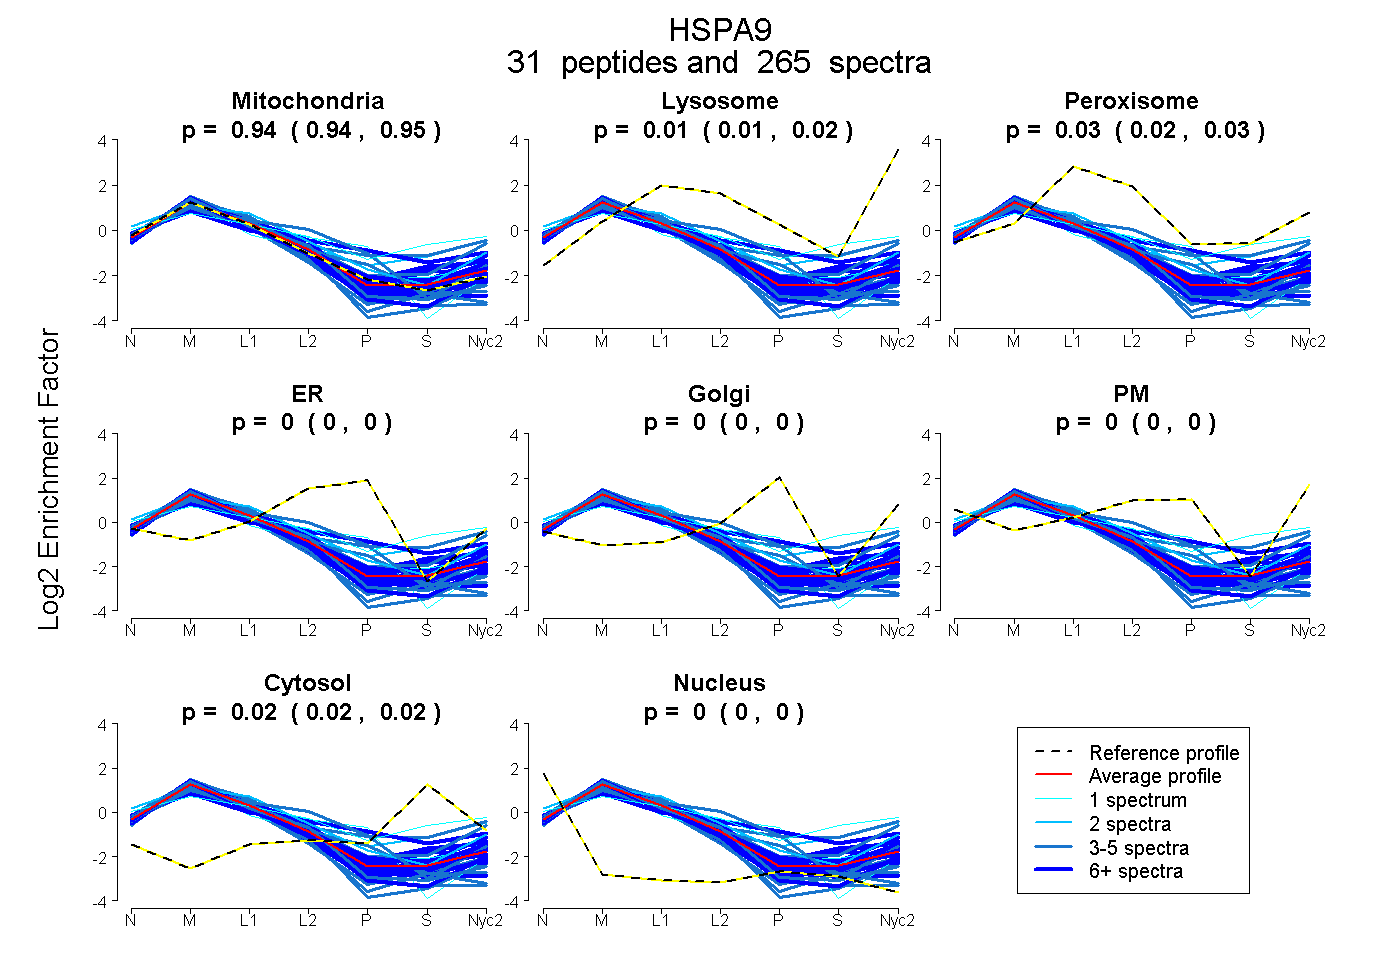
0.941 | 0.946
0.008 | 0.015
0.024 | 0.031
0.000 | 0.000
0.000 | 0.000
0.000 | 0.000
0.015 | 0.018
0.000 | 0.000
24peptides
spectra
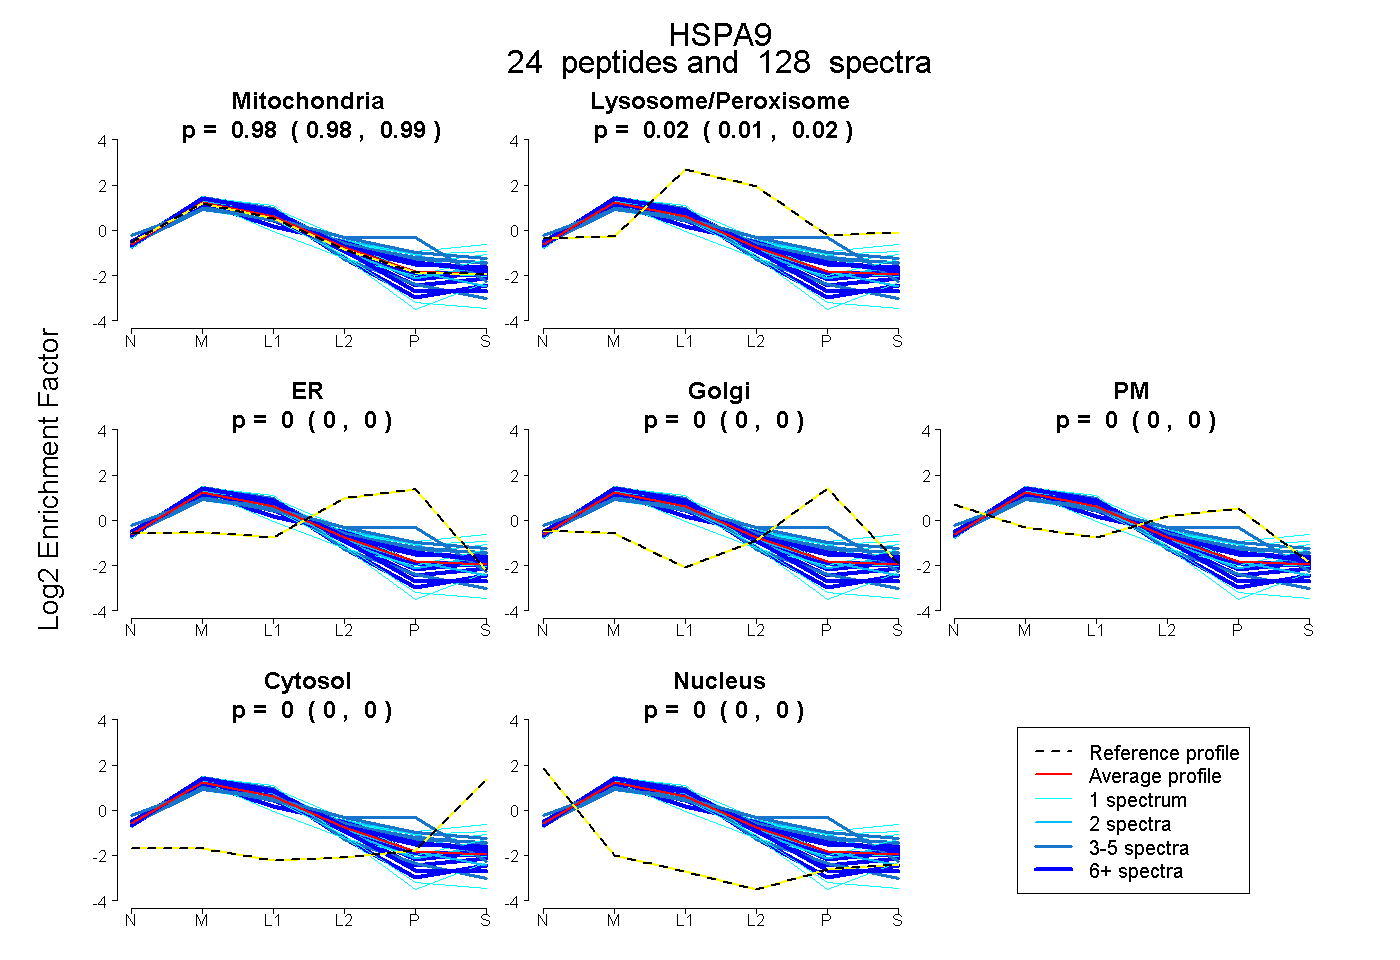
0.979 | 0.986
0.014 | 0.019
0.000 | 0.002
0.000 | 0.000
0.000 | 0.000
0.000 | 0.000
0.000 | 0.000
35peptides
spectra
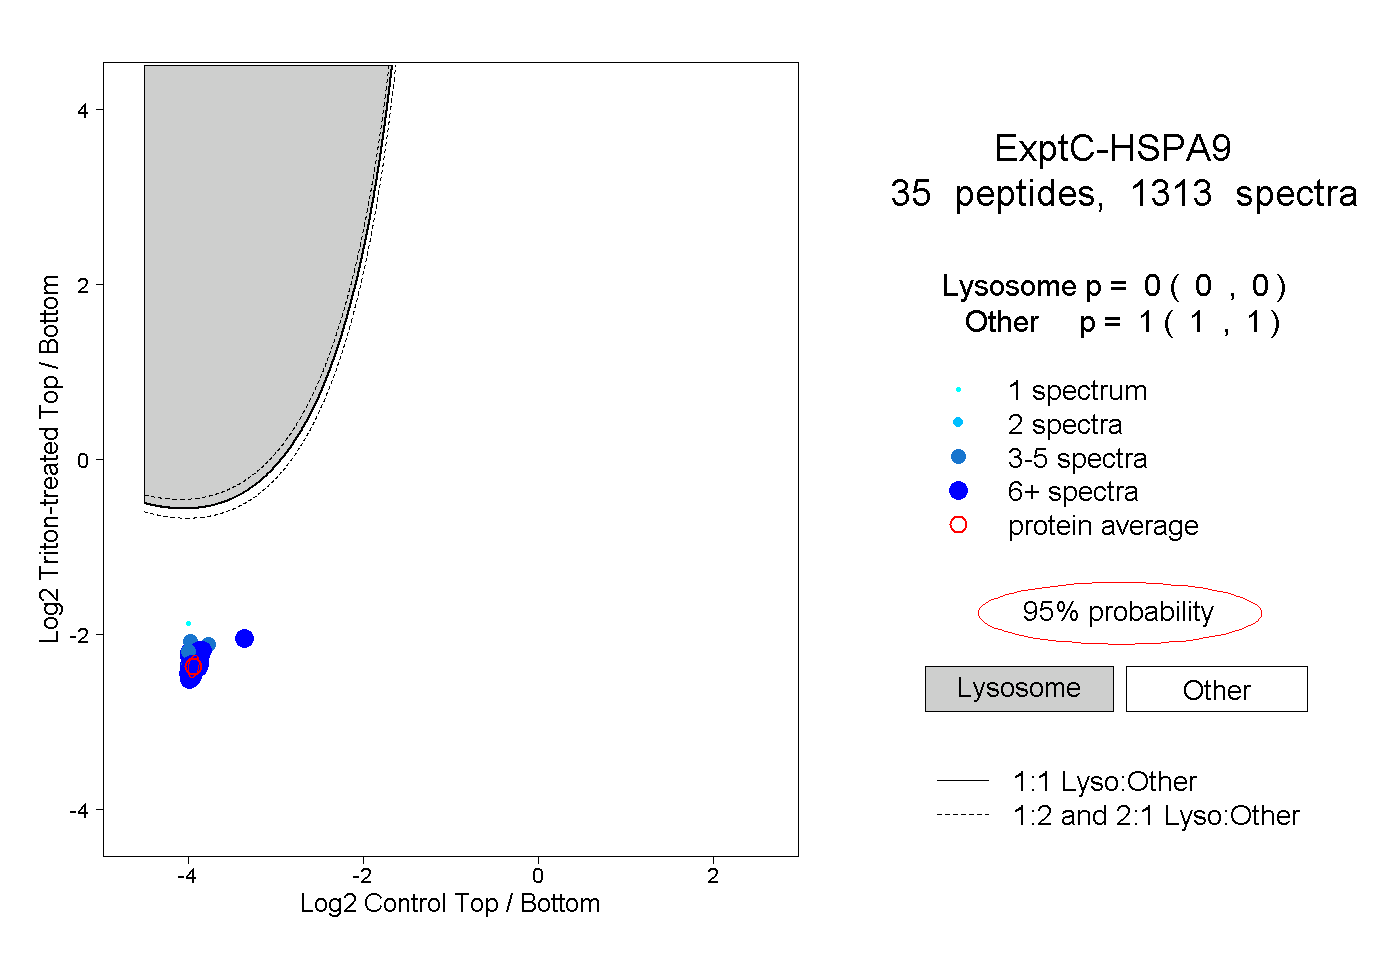
0.000 | 0.000
1.000 | 1.000
21peptides
spectra
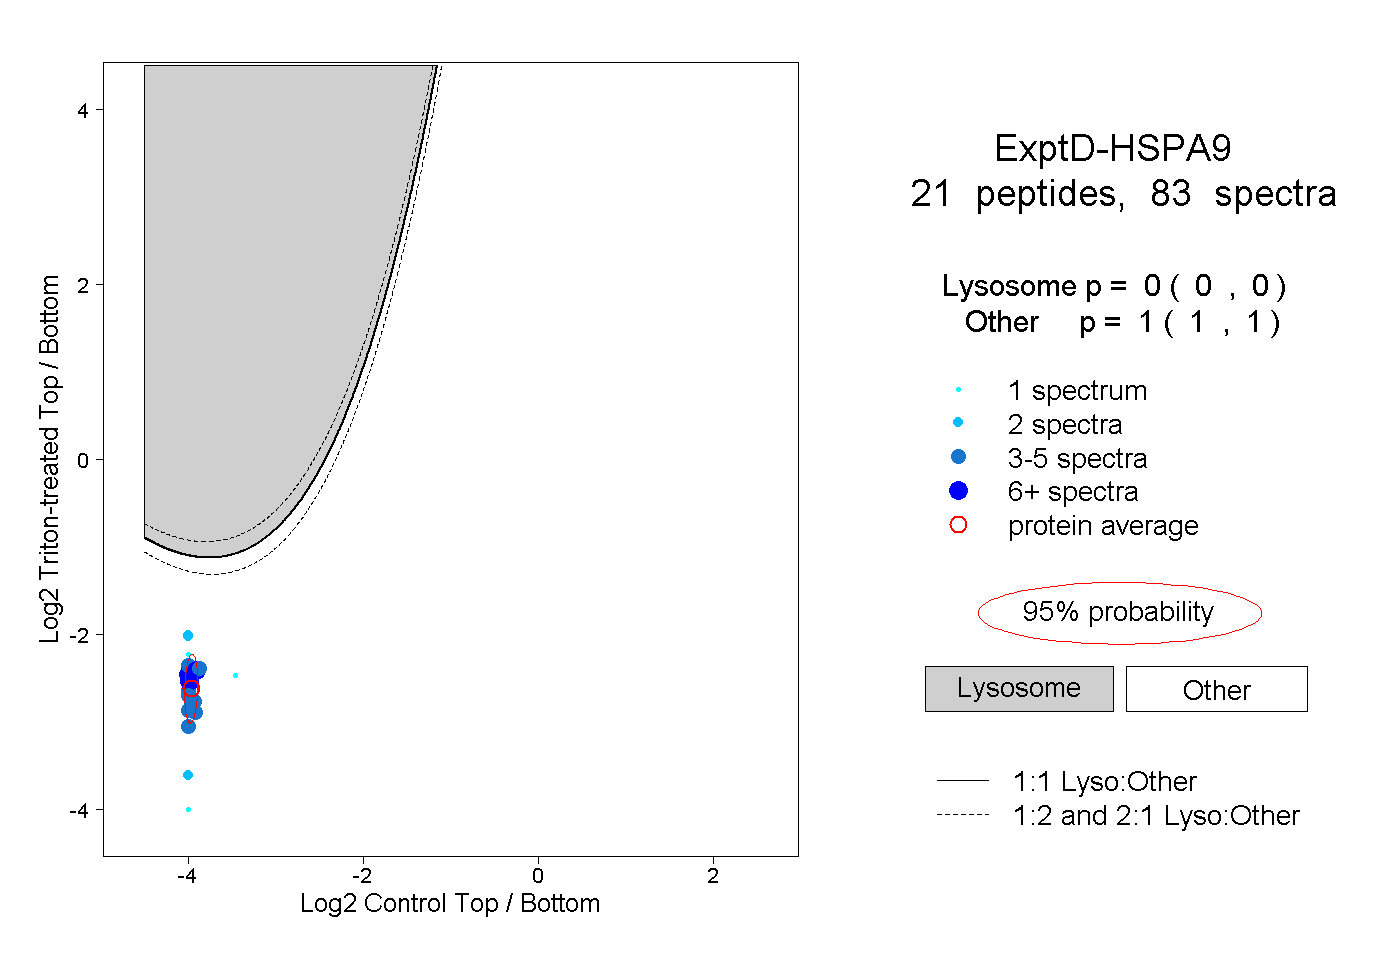
0.000 | 0.000
1.000 | 1.000